Howard Hughes Medical Institute
Spreadsheet Tutorial 2: Autofill Data, Cell References, and Standard Deviation
If you've always wanted to know more about spreadsheets, here's a perfect resource for you. A self-paced tutorial introduces how to autofill and copy formulas in a Google sheet or Excel spreadsheet. It also shows users how to find range,...
Curated OER
Analytical Problem Solving
High schoolers explore about propagation of error in calculations using experimental data. They develop their weighing and pipetting techniques. Students explore the following terms: Standard deviation and relative standard deviatin....
Curated OER
Density of a Paper Clip Lab Review
Even though this assignment is brought to you by Physics Lab Online, it is best used as a math practice. Middle schoolers calculate the range, mean, mode, and median for a list of eight different paper clip densities. They analyze...
Howard Hughes Medical Institute
Spreadsheet Tutorial 3: Column Graphs, Error Bars, and Standard Error of the Mean
There's absolutely no error in using the tutorial! Learners use spreadsheets to create column or bar graphs with error bars. They also learn how to calculate the standard error of the mean in the tutorial. This is the third installment...
Curated OER
Hydrogen Peroxide Analysis
A scenario is presented for chemistry techs to address. Using titration techniques, they must analyze hydrogen peroxide solution samples. They evaluate accuracy and precision in the process. They also gain experience consulting the MSDS...
Curated OER
Basic Stats
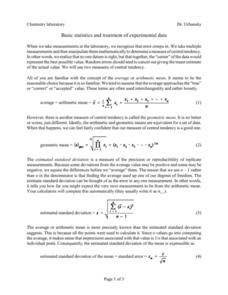
In this chemistry worksheet, young scholars focus upon the concepts of mean and standard deviation and how it is used in the laboratory to interpret data.
Curated OER
Using Computers for Statistical Analysis of Weather
Students use temperature, cloud cover and other weather data from the S'COOL website to statistically analyze weather around the country. They use computers to calculate and graph standard deviations, means and modes of the weather...
Teach Engineering
Measuring Surface Tension
How do you measure surface tension? The fifth installment of a nine-part series is an experiment where young scientists use tubes of different sizes to measure surface tension. They calculate the average and standard deviation of the...
Howard Hughes Medical Institute
Sampling and Normal Distribution
Young scientists learn about sampling and normal distributions through data analysis. A worksheet guides them to better understanding and synthesis of knowledge.
Florida International University
Counting FishStix
How do we count the fish in the ocean? An engaging instructional activity models how to estimate fish populations with observational surveys. Class members begin by studying the behavior of fish on the coral reef in the oceans....
Howard Hughes Medical Institute
Spreadsheet Tutorial 4: t-Test
The t-test tutorial will fit your needs to a T. After calculating the mean, sum of squares, standard deviation, and variance of two data sets on a spreadsheet, scholars learn to calculate the t-values. They then learn to use the TTEST...
Teach Engineering
Understanding the Air through Data Analysis
Is there a correlation or causation relationship between air pollutants? Groups develop a hypothesis about the daily variation of air pollutants, specifically ozone and CO2. Using Excel to analyze the data, the groups evaluate their...
Curated OER
A RealSim Surface Look at Descriptive Statistics
Young scholars explore the concepts of mean and variance. They observe properties of materials to their basic atomic or molecular structure. Students use spreadsheet software to record, tabulate and analyze collected information.
NOAA
Investigating Sea Level Using Real Data
The news reports on rising sea level, but how do scientists measure this rise? Scholars use NOAA data including maps, apps, and images to work through five levels of activities related to sea level. Each level in the series adds a new...
NOAA
Importance of Deep-Sea Ecosystems – What Killed the Seeds?
Most drugs used today come from nature, so the discovery of new ecosystems in the deep sea is exciting from a medical perspective. Scholars develop their own bioassay to test germination rates in seeds.
Curated OER
Significant Science: Statistics for Planet Earth
Ninth graders discover how statistics are used to interpret results of scientific experiments. Students write hypotheses and test the hypotheses by collecting data and organizing the data. Students graph their data to produce a visual....
Curated OER
View Tube Triangulation
Students investigate a particular object then calculate to find the class average and standard deviation. In this measuring distance lesson students list their calculations on a piece of paper.
Curated OER
Population Biology Case Study
Students are focused on the big question: What makes a population grow and how could that growth stop? They use these concepts to help answer the big question: carry capacity, density dependent v. density, independent factors, predation...
Curated OER
Determination of Plasticizer in PVC
Students isolate and determine the amount of plasticizer in polyvinyl chloride. They use Infrared Spectroscopy (IR) or Fourier Transform Infrared Spectroscopy (FTIR) and gravimetric techniques in this experiment.
Curated OER
Heartbeat Project
Learners enter information about their heartbeats into a spreadsheet. They construct data displays and calculate statistics. They describe and justify their conclusions from the data collected.
Curated OER
Zoo Poo
Students use Internet research to determine the amount of carbon dioxide produced per unit energy for biomass and coal. In this alternative energy lesson, students research to find out how much energy and carbon dioxide several coal and...
Curated OER
Ants
Students make sequential patterns by using ants and following the model. They identify different parts of an ant by matching the picture to the word name. Pupils identify the ant's life cycle by creating a chart using pictures.
Cornell University
Shedding a "Little" Light on Cancer Surgery
Many types of cancer treatments now depend on nanotechnology—a big "little" discovery. Scholars begin by removing "malignant" tissue from simulated brains, one using fluorescent markers thanks to nanotechnology and one without. This...
Science Geek
Gas Laws
A physical science presentation begins with an explanation of ideal gases and their behavior. Then it introduces all of the gas laws with descriptions and formulas.
Other popular searches
- Standard Deviation and Mean
- Mean Standard Deviation
- Math Standard Deviation
- Standard Deviation Z Score
- Chemistry Standard Deviation
- Standard Deviation Computer
- Mean, Standard Deviation
- Standard Deviation Madekine
- Standard Deviation Made Kine


