Curated OER
As Good As Gold
Students find examples of the Golden Ratio on the human body through measurement. Additionally, students learn about the use of the Golden Ratio and the Golden Rectangle in art and architecture. A very interesting lesson for the students!
EngageNY
Margin of Error When Estimating a Population Proportion (part 2)
Error does not mean something went wrong! Learners complete a problem from beginning to end using concepts developed throughout the last five lessons. They begin with a set of data, determine a population proportion, analyze their result...
MENSA Education & Research Foundation
Fabulous Fibonacci and His Nifty Numbers
Fibonacci numbers are not only found in the classroom but also in nature. Explore the concept of Fibonacci numbers through a series of lessons designed to gain insight into the mathematical reasoning behind the number pattern, and spark...
MENSA Education & Research Foundation
Early American Novel: Exploring the Emergence of a Genre
Need an extra challenge for your best readers? Check out a unit that uses Hannah Webster Foster’s epistolary novel, The Coquette, published in 1797, as the anchor text. The resource is packed with project ideas; each with its...
Curated OER
Percentiles
Students analyze the bell curve and make predictions. In this statistics lesson, students calculate the percentile to the left of the curve. They then are given the percentile and create the graph from the data.
Curated OER
What is a P-value?
Students test the hypotheses using p values. In this statistics activity, students define and examine conditional probability. They test each statement for a true statement or a false statement, based on the sample size.
Curated OER
Algebra 2/Trigonometry Regents Exam
Young scholars review for the Regents Exam. In this math instructional activity, students review core concept for the Regents exam by working a variety of problems. A printable worksheet is provided.
Curated OER
Meaning of Alpha
learners define the alpha level. In this statistics lesson, students identify what makes the "null rejected" and discuss the data surrounding the null. They observe the meaning of alpha as it relates to the bell curve.
Curated OER
Trash Inventions
Second graders develop a plan to recycle trash. In this environmental science lesson, 2nd graders sketch their invention and construct it. They present the final product in class.
Curated OER
From Above
Students use maps and other geographic representations, tools, and technologies to acquire and report information from a spacial perspective.
Curated OER
Water Quality Monitoring
Students comprehend the four parameters of water quality. They perform tests for salinity, dissolved oxygen, pH and clarity or turbidity. Students comprehend why scientists and environmental managers monitor water uality and aquatic...
Curated OER
Evolution: Is It Fact and/or Theory?
Students explore the concepts of evolution. In this biology instructional activity, students read articles from the internet. They discuss the article within the group and answer their handouts.
Math Is Fun
Math Is Fun: Standard Normal Distribution Table
An explanation of standard normal distribution along with a table of values.
CK-12 Foundation
Ck 12: Statistics: Normal Distributions Advanced
[Free Registration/Login may be required to access all resource tools.] This concept introduces students to the standard normal probability distribution.
CK-12 Foundation
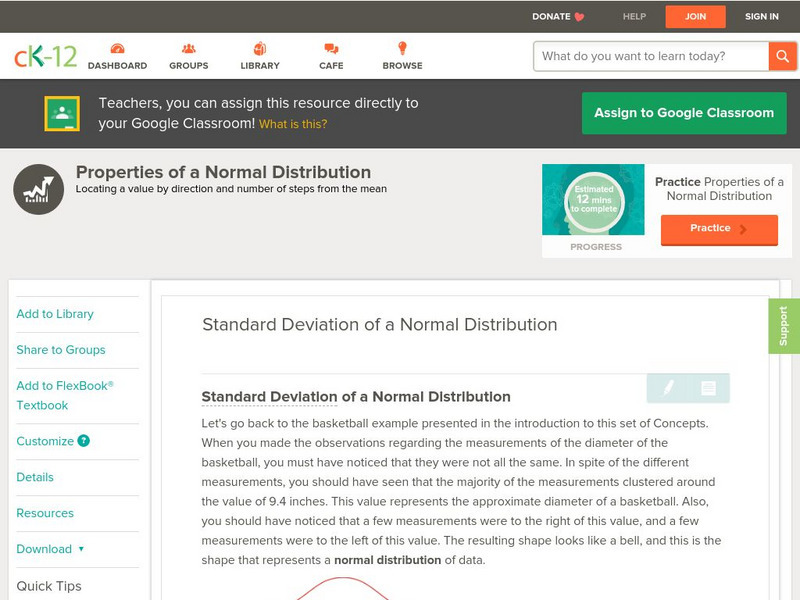
Ck 12: Statistics: Standard Deviation of a Normal Distribution
[Free Registration/Login may be required to access all resource tools.] Learn about the spread of a normal distribution.
Khan Academy
Khan Academy: Normal Distributions Review
Normal distributions come up time and time again in statistics. A normal distribution has some interesting properties: it has a bell shape, the mean and median are equal, and 68% of the data falls within 1 standard deviation.
Interactive Mathematics
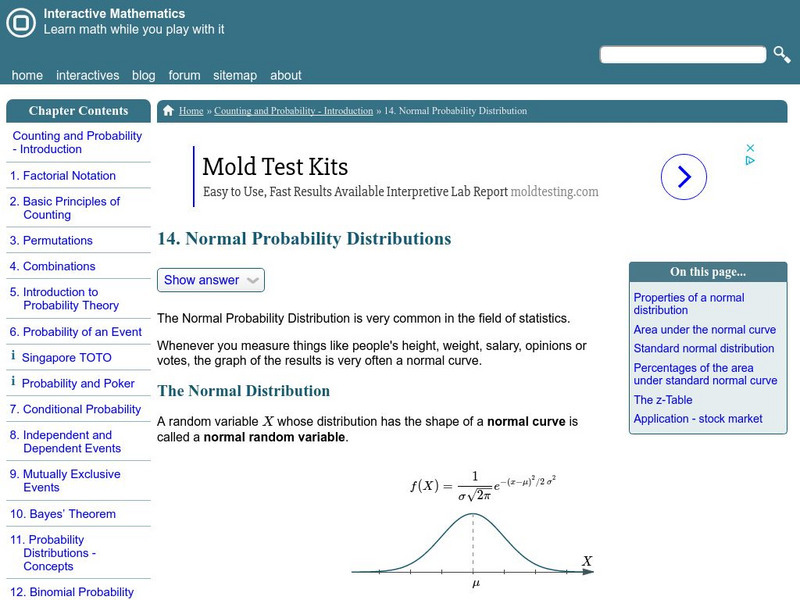
Interactive Mathematics: The Normal Distribution
Formulas and properties of the normal distribution are presented, including details on the normal random variable and the standard normal distribution. Several real world examples are also included with detailed solutions.
Texas Instruments
Texas Instruments: Normal Distribution
This set contains statistics questions regarding the normal curve, its distribution, and its applications. The student, using the correct calculation, transitions between observed x-values, standard z-scores, and normal curve areas.
Shodor Education Foundation
Shodor Interactivate: Normal Distribution
Change the standard deviation of an automatically generated normal distribution to create a new histogram. Observe how well the histogram fits the curve, and how areas under the curve correspond to the number of trials.
University of Glasgow
Steps Statistics Glossary: Normal Distribution
Overview of normal distribution, including the normal distribution model, the probability density function, and standard normal distribution. The parameters for "normal" distribution are provided.
Wolfram Research
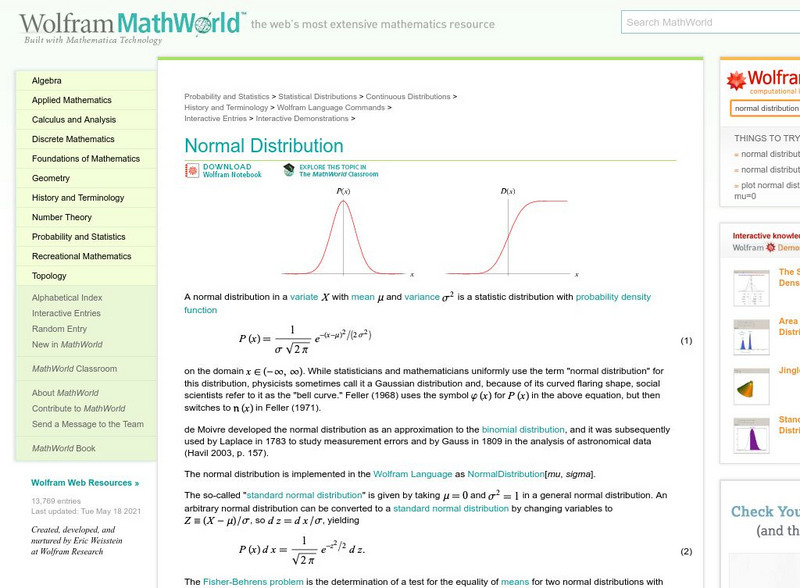
Wolfram Math World: Normal Distribution
Math World explains the normal distribution with links to help with unfamiliar topics and terms. The site explains how to convert from a normal distribution to a standard normal distribution. Some prior knowledge of statistics and normal...
Math Planet
Math Planet: Algebra 2: Standard Deviation and Normal Distribution
Gain an understanding of standard deviation and normal distribution by viewing an example and a video lesson.
Missouri State University
Missouri State University: Introductory Statistics: The Normal Curve
Provides lengthy explanations of the measures of central tendencies - mean, mode, and median - and the measures of variability - range, variance, standard deviation - are given here. Graphs of interesting "side items" are presented as...
Palomar Community College District
Palomar College: The Normal Curve an Example
A collection of step-by-step worked problems demonstrating how to take a normal curve and determine the probability (area) under it. Hints are provided along the way and the final measures are shown for the user to check.


