EngageNY
Fair Games
What constitutes a fair game? Scholars learn about fair games and analyze some to see if they are fair. They extend this idea to warranties and other contexts.
EngageNY
Using Sample Data to Compare the Means of Two or More Populations II
The 23rd segment in a series of 25 presents random samples from two populations to determine whether there is a difference. Groups determine whether they believe there is a difference between the two populations and later use an...
EngageNY
Random Sampling
Sample pennies to gain an understanding of their ages. The 16th installment of a 25-part series requires groups to collect samples from a jar of pennies. Pupils compare the distribution of their samples with the distribution of the...
EngageNY
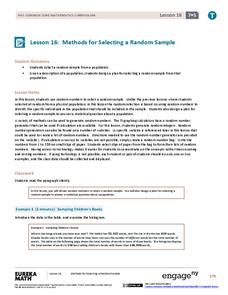
Methods for Selecting a Random Sample
Random sampling is as easy as choosing numbers. Teams use random numbers to create a sample of book lengths from a population of 150 books. The groups continue by developing a technique to create samples to compare from two populations...
EngageNY
Using Sample Data to Compare the Means of Two or More Populations
Determine whether there is a difference between two grades. Teams generate random samples of two grade levels of individuals. Groups use the mean absolute deviation to determine whether there is a meaningful difference between the...
EngageNY
Describing the Center of a Distribution Using the Median
Find the point that splits the data. The lesson presents to scholars the definition of the median through a teacher-led discussion. The pupils use data lists and dot plots to determine the median in sets with even and odd number of data...
EngageNY
Displaying a Data Distribution
Pupils analyze a display of data and review dot plots to make general observations about the highest, lowest, common, and the center of the data. To finish, learners match dot plots to scenarios.
Education Development Center
Choosing Samples
What makes a good sample? Your classes collaborate to answer this question through a task involving areas of rectangles. Given a set of 100 rectangles, they sample a set of five rectangles to estimate the average area of the figures. The...
Kenan Fellows
Least Squares Linear Regression in R
The task? Determine the how effective hospitals are at reducing the rate of hospital-acquired infections. The method? Data analysis! Using an open source software program, individuals use provided data and create scatterplots to look for...
Curated OER
Telling Time to 5 Minutes
In this second grade lesson your class will practice telling time. The goal is to tell time to five minutes using an analog clock. Your young students count by 5 minute intervals and discuss elapsed time.
Curated OER
How Mountains Shape Climate
Students use raw data to make a climatograph; they explain the process of orographic precipitation and the concept of a rain shadow.
Curated OER
Mean Absolute Deviation in Dot Plots
The lesson focuses on the ideas of dot plot representations and the mean absolute deviation of data sets.
Illustrative Mathematics
Words and Music I
What type of music is best to listen to while learning? In a short writing prompt, learners must determine if a scenario involving listening to music while memorizing material is an experiment or an observational study. The prompt also...
Illustrative Mathematics
High Blood Pressure
Does watching TV increase one's blood pressure? Assess student understanding of how study design dictates whether a conclusion of causation is warranted. Use this as a prompt for a small group or whole class discussion, or as a part of a...
Curated OER
Property: Ownership, Respect, and Responsibility
Students learn to respect others' property by rating the severity of a variety of damaging acts. Students use a tag board "thermometer" to rate the severity of statements describing situations where a person damages the property of another.
Curated OER
The Perfect Principal
Students demonstrate their understanding of math skills. In this data analysis activity, students complete a worksheet requiring them to calculate mean, median, and mode, and create and interpret graphs. Lesson is intended as an...
Curated OER
How Long? How Wide?
Second graders distinguish between and use nonstandard and standard units of measurement, use appropriate tools and techniques to measure length and width, and record and interpret data using graphs.
Curated OER
Our Favourite Halloween Treat
Students conduct a survey about Halloween candy and create a bar graph illustrating the data. In this data analysis lesson, stud nets are introduced to the topic with a discussion and survey, then the class creates a large graph and...
Curated OER
How Many People Live in Your Household?
Students create a pictograph showing household size for the class.In this data collection and graphing lesson, the teacher guides students through the creation of a concrete object graph, then students analyze and summarize the results.
Curated OER
The Important Thing About Reading
Third through fifth graders discover the importance of reading and plan a service project to provide books to children. First, they read the book The Important Book and then they brainstorm about the importance of reading. Afterward,...
Curated OER
Dubious Adoption Data
Young scholars analyze a graph from the New York City Administration for Children's Services that shows a significant increase in New York City adoptions after ACS was founded. They determine whether the graph supports ACS' claims and...
Curated OER
Arrange the Classroom (Part 1 of 3)
Fifth graders arrange the classroom using all the moveable objects and through the exploration of area and perimeter. They determine the area of the classroom, create and label model pieces of furniture using graph paper, and create a...
Curated OER
Design-A-Room Project (Part 3 of 3)
Students culminate a unit on measurement with a focus on area and perimeter. They design a floor plan of their dream room on graph paper showing the proper area and perimeter. They plan the budget for their room and make a 3-D scale...
Curated OER
Acceptance Sampling
In this algebra lesson, students sample food and identify acceptance sampling. They create specific plans to meet specific situations as they sample the food. There are 6 questions.


