Statistics Education Web
Walk the Line
How confident are you? Explore the meaning of a confidence interval using class collected data. Learners analyze data and follow the steps to determine a 95 percent confidence interval. They then interpret the meaning of the confidence...
Curated OER
Discovering Advanced Algebra More Practice Your Skills, Lessons 11.1-11.6
In this six page series of activity, students answer short answer questions about a variety of topics. The six topics covered in this packet are: Experimental Design (4 questions), Probability Distributions (3 multiple choice questions),...
Curated OER
Percentiles
Students analyze the bell curve and make predictions. In this statistics lesson, students calculate the percentile to the left of the curve. They then are given the percentile and create the graph from the data.
Curated OER
Z-Scores
Students solve problems by identifying the percent of area under the curve. In this statistics lesson, students discuss z-scores as they calculate the different percentages under the bell curve. They calculate the standard deviation.
Curated OER
What is a P-value?
Students test the hypotheses using p values. In this statistics activity, students define and examine conditional probability. They test each statement for a true statement or a false statement, based on the sample size.
Curated OER
Bell Curve
Students explore averages by completing a data analysis activity. In this bell curve lesson, students measure different food items and plot their measurements on a X and Y axis. Students create bell curves around the average weight or...
Radford University
Are Kitchen Cabinets at the Correct Height? Lesson 6
Don't hit your head on the kitchen cabinet. Using previously collected female height data, scholars apply confidence intervals and tests of significance to perform a data analysis. They connect the data to the height
of kitchen cabinets...
Radford University
Let's Buy a Car
Ready to buy a car? Learners research different makes and models of cars to decide on the best one to buy. They collect data on cost, fuel efficiency, safety ratings, and insurance costs, then create and analyze data displays to make...
Curated OER
Statistics
High schoolers log their computer usage hours. They determine the mean, median, mode and standard deviation of the collected data. They make a frequency histogram of the grouped data, both on graph paper, and on the TI 83+ graphing...
Curated OER
Human Population- Changes in Survival Rates Data Interpretation
In this human population changes in survival worksheet, students interpret and plot data to understand the differences in human mortality and survivorship between historic and modern times. They investigate how these changes influence...
EngageNY
Margin of Error When Estimating a Population Proportion (part 2)
Error does not mean something went wrong! Learners complete a problem from beginning to end using concepts developed throughout the last five lessons. They begin with a set of data, determine a population proportion, analyze their result...
Curated OER
Meaning of Alpha
learners define the alpha level. In this statistics lesson, students identify what makes the "null rejected" and discuss the data surrounding the null. They observe the meaning of alpha as it relates to the bell curve.
Curated OER
Hypothesis Testing: Claim on Mean; Population Standard Deviation Unknown
In this statistics worksheet, students test given claims using traditional methods of hypothesis testing. Students assume that sampling is randomly generated.
Curated OER
The Power of Graphical Display: How to Use Graphs to Justify a Position, Prove a Point, or Mislead the Viewer
Analyze different types of graphs with learners. They conduct a survey and determine the mean, median and mode. They then identify different techniques for collecting data.
Curated OER
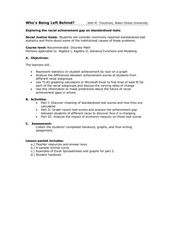
Who is Being Left Behind?
Students investigate scores as they relate to race. In this algebra lesson, students analyze standardized scores and how race can affect these scores. They plot their findings on a graph and draw conclusions.
Curated OER
Algebra 2/Trigonometry Regents Exam
Young scholars review for the Regents Exam. In this math instructional activity, students review core concept for the Regents exam by working a variety of problems. A printable worksheet is provided.
Curated OER
Numerical Analysis: Introduction to Approximation Theory
In this introduction to approximation theory, students compute the slope and intercept of a line. They describe nonlinear relationships. This four page worksheet contains approximately five problems.
Illustrative Mathematics
Accuracy of Carbon 14 Dating I
Here is an activity that is intended to highlight a very important issue about precision in reporting and understanding statements in a realistic scientific context. Discuss different ways of reporting the half life of Carbon 14...
Curated OER
Hypothesis Testing: Two Sample Tests
Students experiment and compare results of two populations. In this men and women populations lesson, students examine the difference in hand span for men and women. Students calculate a norm based on their...
Curated OER
Time Management: Piece of Pie
Middle schoolers examine their own lives and how well they manage their time outside of school. For this this time management lesson, students discover the amount of time they spend on other activities, and create a pie chart with that...
CK-12 Foundation
Ck 12: Statistics: Normal Distributions Advanced
[Free Registration/Login may be required to access all resource tools.] This concept introduces students to the standard normal probability distribution.
CK-12 Foundation
Ck 12: Statistics: Normal Distributions
[Free Registration/Login may be required to access all resource tools.] Determine if a data set approximates a normal distribution.
Texas Instruments
Texas Instruments: The Normal Distribution
Students graph normal distributions, shade desired areas, and find related probabilities. They graph Normal probability scatter plots to check the normal (linear) shape of a data distribution.
CK-12 Foundation
Ck 12: Statistics: Standard Deviation of a Normal Distribution
[Free Registration/Login may be required to access all resource tools.] Learn about the spread of a normal distribution.


