Curated OER
Box Plots
Young statisticians are introduced to box plots and quartiles. They use an activity and discussion with supplemental exercises to help them explore how data can be graphically represented.
Curated OER
Stemmin'-n-Leafin'
Students make stem and leaf charts to determine the measures of central tendency using test score data. They analyze the data to draw inferences which they share with the class. They complete the associated worksheets.
Curated OER
Plot It
Young scholars use a stem-and-leaf plot from a set of data to identify the range, median, and mode of their own math grades.
Curated OER
Tech Algebra: A Statistics Study
Pupils use the internet to gather a minimum of thirty pieces of data. Students create box and whisker graphs, and stem and leaf plots from the information. They calculate mean, median, mode, and range. Pupils write a summary and...
Curated OER
Stem and Leaf Plots
In this math worksheet, students organize data into stem and leaf plots. They select the correct stem to use to organize the data. Students analyze the data on a given stem and leaf plot.
Virginia Department of Education
Graphs
Examine different types of graphs as a means for analyzing data. Math scholars identify the type of graph from a series of data displays and then develop questions to match each one. Then, given a scatter plot of height versus age data,...
Curated OER
Record 'The' Results
Third graders predict how many times they'll see the word "the" in a newspaper page and highlight all the "the"s they find. After reviewing definitions of range, median, mode, mean they create a Stem and Leaf Plot and a Back-to-Back Stem...
Curated OER
Interpreting and Displaying Sets of Data
Students explore the concept of interpreting data. In this interpreting data lesson, students make a line plot of themselves according to the number of cubes they can hold in their hand. Students create their own data to graph and...
Curated OER
Graph It!
There is more than one way to represent data! Learners explore ways to represent data. They examine stacked graphs, histograms, and line plots. They conduct surveys and use stacked graphs, histograms, or line plots to chart the data they...
Curated OER
Skittles, Taste the Rainbow
Fifth graders learn and then demonstrate their knowledge of a bar and a circle graph using the classroom data. Students are given a pack of skittles candy. Students create a bar and circle graph indicating the results of the contents of...
Curated OER
Investigation - How Tall is the Average Sixth Grader?
Students will measure each other and record the data in inches. They will use a stem and leaf plot to display data and figure out the average height of the students in a class. The other statistical data will be collected like the mode...
Curated OER
Plotting with Pennies
Fifth graders use pennies to gather data, organize and order data, graph the data on a stem-and-leaf plot, and evaluate the range, median, and mode of the data.
Curated OER
Univariate Data Analysis
Students use given data to compare baseball players. They create box and whisker plots to compare the players and determine which they feel is the best player. Students use calculators to make box and whisker plots. They write paragraphs...
Curated OER
Box Plots on the TI-83 Calculator
Eighth graders research box plots on the Internet. They gather real life statistics and analyze the collected statistics by making multiple box plots on the TI-83 calculator.
Curated OER
Smile Metric Style
Students explore how to use a metric ruler to measure length, accurately read and record measurements taken in centimeters (cm) and millimeters (mm), and collect and analyze data using a stem and leaf.
Curated OER
Statistics with State Names
Students analyze the number of times each letter in the alphabet is used in the names of the states. In this statistics lesson, students create a stem and leaf plot, box and whisker plot and a histogram to analyze their data.
Curated OER
Integration: Statistics
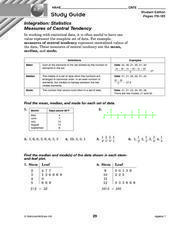
For this math worksheet, learners find the mean, median and mode for 6 number sets. Students then find the median and mode for data found in 2 stem-and-leaf plots.
Curated OER
Histograms and Statistical Graphics
In this statistics worksheet, students solve 6 data problems. They construct a histogram of given data, they create a frequency polygon, and a stem and leaf diagram. Students create a dot plot and a pie chart for given data sets. On the...
Curated OER
Who's got the fastest legs?
Students use a stopwatch to collect information for a scatterplot. In this fastest legs lessons, students collect data through the taking of measurements, create and find a median number. Students develop an equation and answer...
Curated OER
Probability Popsicle Pop-ups
Fourth graders decorate and use popsicle sticks as manipulatives to assist with their learning of probability. They utilize a worksheet imbedded in this plan to organize the results of their experiment. They make a stem and leaf plot...
Curated OER
Box-and-Whisker Plots
Eighth graders measure in feet and inches and convert to explore the relationship between the converted measurements. In this measurement lesson, 8th graders use the whisker and box plot to represent the measurement of a cat. Students...
Curated OER
The Dog Days of Data
Students practice an alternative form of data presentation. They practice sequencing data, identifying the stem-and-leaf, creating stem-and-leaf plots, and drawing inferences from the data by viewing the plots.
Curated OER
Bringing Statistics Alive
Students compute mean, median and mode and compare mean, median and mode to a real-world application to identify their practical uses. They apply mean, median and mode to real-world statistical data. Finally, students organize data into...
Curated OER
Types of Graphs
Fifth graders construct graphs. In this graphing lesson plan, 5th graders learn about various types of graphs such as bar, line, circle, picture and stem and leaf plot. Students work in groups to create examples of each graph.


