Curated OER
Hurricanes and Tornadoes (Grade 4-8)
Young scholars investigate the concepts of hurricanes and violent weather conditions. In this violent weather lesson, students access an Internet site and watch a video about how air masses behave, how a tornado forms, how hurricanes...
Curated OER
How Diverse is That?
After reviewing biodiversity, learners work in small groups to analyze actual species distribution data. They learn to calculate the Shannon-Weaver diversity index for different communities. Though not particularly engaging, the content...
Curated OER
Fresh Water and land of Kiribati and Hawaii (Molokai)
Fourth graders examine the islands of Hawaii. Using this information, they organize it and create a map or graph that represents the data. As a class, they discuss how the watersheds on the islands are different and how people react to...
Curated OER
Traditional Weather Observations
Students explore traditional methods of weather observation. In this weather lesson plan, students interview grown-ups regarding wind. Students learn how winds can help forecast weather.
Curated OER
Solar Storms
Students investigate the cycles of solar activity. They plot the solar activity and use the graph to answer a number of questions and explain the relationship between the solar storms and sunspots and the impact on earth and space travel.
Curated OER
Do You Have Change?
Students analyze data and complete a worksheet about land use change in a coastal region. In this land use lesson, students discuss events that cause land use changes in coastal areas. They construct a change table to summarize data on...
Curated OER
Stars and Stripes Forever: Researching Veteran's Day and Historical Events
Sixth graders research Veteran's Day and wars that affected the United States. In this research instructional activity, 6th graders work in small groups to create an oral presentation based on Internet and conventional research. They...
Curated OER
A Taste of Our Classroom
Students explore their classroom tastes. In this lesson plan, students list the four tastes that the tongue can detect, map the individual areas of taste on the tongue, and demonstrate the ability to identify objects through the use of...
Techbridge Curriculum
Calculating Rainwater Runoff
Thirsty plants soak up every bit of a rainfall, but what happens to the rain that hits the roof? Calculate the amount of rainwater from your school's roof with an Earth science activity, which brings measurement skills, observation...
International Technology Education Association
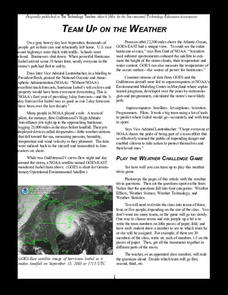
Team Up on the Weather
There's a little bit about every aspect of weather in this trivia game. The lesson resource provides 36 questions and answers pertaining to four different topics related to weather: effects, science, technology, and statistics. Groups...
Curated OER
Solar Flares and Coronal Mass Ejections
In this solar flares and coronal mass ejections worksheet, students create a Venn Diagram with given data about solar flares and Halo CMEs. Students answer 6 questions about the events and the probability of each type of event occurring...
Curated OER
Do Fast CMEs Produce Intense SPEs?
In this coronal mass ejections and Solar Proton Events worksheet, students create a Venn Diagram to represent given data. They answer 5 questions about the data related to the number of coronal mass ejections and Solar Proton Events...
Curated OER
Air Pollution:What's the Solution?-Weather's Role
In this air pollution and weather worksheet, students collect data using an online animation to determine the air quality at given times along with the wind speed and temperature in a particular city. Students make 3 bar graphs using the...
NASA
The Effects of Sunspots on Climate
In this sunspots and climate change learning exercise, learners use a diagram of a tree stump and its rings to determine the age of the tree. They use sunspot data from the internet and they construct an Excel spreadsheet to compare the...
Curated OER
Environment: Wild Wind Direction
Students examine the different types of wind patterns. Using common materials, they construct weather vanes to measure and record wind direction over a two-week period. After analyzing the data, they draw conclusions about the...
Curated OER
Science: How's the Weather?
Fifth graders brainstorm meteorological terms to create a semantic web using SuperPrint. For each topic, they create instruments, such as barometers or psychomotors, that they use to make scientific predictions about the weather. After...
Curated OER
Keeping Watch on Coral Reefs
High schoolers investigate the dangers Coral Reefs face by investigating satellite images. In this environmental protection lesson, students utilize the Internet to discover the types of satellites and sensors used to provide...
Curated OER
The Big Blow
Students identify and explain factors that contribute to extreme storms in the Great Lakes. For this investigative lesson students study the weather systems in the Great Lakes and compare cyclones to tropical storms.
PHET
AM Radio Ionosphere Station
Tune in! Young scientists use an AM radio at home to monitor solar output. The long-term project would be ideal in a flipped classroom or as an out-of-class project.
MENSA Education & Research Foundation
Hurricanes
Learn the ins and outs of hurricanes through a series of lessons answering, "What is a hurricane? How does it travel? How is one formed, measured, and named?" Information is presented through informative text and images, while...
Curated OER
Storm Drain Survey
Students describe what stormwater and storm drains are. They explain reasons for having stormwater management system. They describe nonpoint source pollution and identify causes and impacts of it.
Curated OER
Water Pollution Lesson Plan: What's the Flow?
Students study urban runoff. They identify the urban runoff in a simulated area and determine peak flows using charted data. Finally, they discuss possible causes of the differences in flow rates.
Curated OER
Why We Count
Learners visualize census data on a map and use a map key to read a population map. In this census lesson, students use a map of the Virgin Islands and corresponding worksheets to gain an understanding of population density.
Common Sense Media
Identifying High-Quality Sites
Use a Huffington Post article focused on false pictures of Hurricane Sandy to launch a discussion about the reliability of online information. Groups compare and contrast how print and broadcast media regulate data gathering with the...


