International Technology Education Association
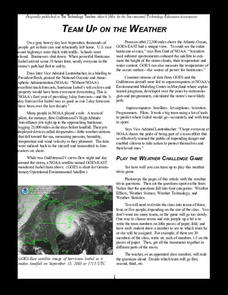
Team Up on the Weather
There's a little bit about every aspect of weather in this trivia game. The lesson resource provides 36 questions and answers pertaining to four different topics related to weather: effects, science, technology, and statistics. Groups...
Teach Engineering
Hurricanes
When a levee fails, it means disaster. Introduce your class to hurricanes and the technologies used to help protect against them. The included presentation provides background information using Hurricane Katrina as a reference.
MENSA Education & Research Foundation
Hurricanes
Learn the ins and outs of hurricanes through a series of lessons answering, "What is a hurricane? How does it travel? How is one formed, measured, and named?" Information is presented through informative text and images, while...
Curated OER
Hurricane Tracking
Pupils recognize that hurricanes are tropical storms that have a sustained wind speed greater than 74 miles per hour. For this science lesson, students plot data they observe on the National Hurricane Center Website in order to track the...
Curated OER
Solar Flares and Coronal Mass Ejections
In this solar flares and coronal mass ejections worksheet, students create a Venn Diagram with given data about solar flares and Halo CMEs. Students answer 6 questions about the events and the probability of each type of event occurring...
Curated OER
Do Fast CMEs Produce Intense SPEs?
For this coronal mass ejections and Solar Proton Events worksheet, learners create a Venn Diagram to represent given data. They answer 5 questions about the data related to the number of coronal mass ejections and Solar Proton Events...
Curated OER
Air Pollution:What's the Solution?-Weather's Role
For this air pollution and weather worksheet, students collect data using an online animation to determine the air quality at given times along with the wind speed and temperature in a particular city. Students make 3 bar graphs using...
NASA
The Effects of Sunspots on Climate
For this sunspots and climate change learning exercise, learners use a diagram of a tree stump and its rings to determine the age of the tree. They use sunspot data from the internet and they construct an Excel spreadsheet to compare the...
Curated OER
Environment: Wild Wind Direction
Young scholars examine the different types of wind patterns. Using common materials, they construct weather vanes to measure and record wind direction over a two-week period. After analyzing the data, they draw conclusions about the...
Curated OER
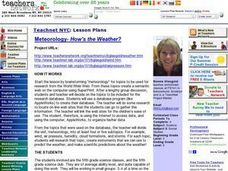
Science: How's the Weather?
Fifth graders brainstorm meteorological terms to create a semantic web using SuperPrint. For each topic, they create instruments, such as barometers or psychomotors, that they use to make scientific predictions about the weather. After...
Curated OER
Keeping Watch on Coral Reefs
Students investigate the dangers Coral Reefs face by investigating satellite images. In this environmental protection lesson, students utilize the Internet to discover the types of satellites and sensors used to provide oceanographic...
Curated OER
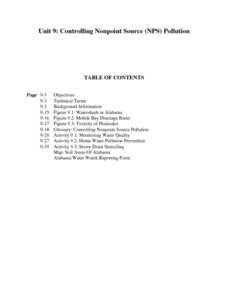
Controlling Nonpoint Source Pollution
Students examine factors affecting water quality. They test water in a local body of water to determine its quality. They collect data and continue monitoring the water monthly. They assess water quality in the home and on the farm.
Curated OER
Water Pollution Lesson Plan: What's the Flow?
Students study urban runoff. They identify the urban runoff in a simulated area and determine peak flows using charted data. Finally, they discuss possible causes of the differences in flow rates.
Curated OER
Why We Count
Learners visualize census data on a map and use a map key to read a population map. In this census lesson, students use a map of the Virgin Islands and corresponding worksheets to gain an understanding of population density.
Common Sense Media
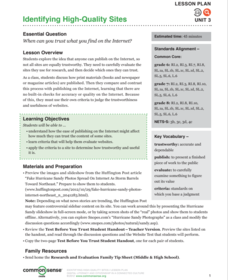
Identifying High-Quality Sites
Use a Huffington Post article focused on false pictures of Hurricane Sandy to launch a discussion about the reliability of online information. Groups compare and contrast how print and broadcast media regulate data gathering with the...
Curated OER
Phenomenal Weather-Related Statistics
Eighth graders research, collect and interpret data about weather statistics. They record that data on spreadsheets. they create Powerpoint presentations on their individual or group research.
NOAA
Earth Origami
After reading a brief history of Carl Skalak's journey on the open waters, scholars make a three-dimensional model of the Earth out of an Origami balloon using a printable decorated as the Earth.
Weather Bug
WeatherBug
Exploring the weather has never been more intriguing! Whether you are looking for a quick glance at the 10-day forecast, trying to figure out if lightning is heading your way, or wondering what the pollen count is, you will find out...
University of Wisconsin
Follow the Drop
Young surveyors look for patterns in water flow around campus. Using a map of the school (that you will need to create), they mark the direction of the path of water. They also perform calculations for the volume that becomes runoff. The...
PBS
The Air in There
Feeling is believing! Youth discuss how they know air exists using evidence-based logic. They then create air cannons from cardboard, cling wrap, and rubber bands to demonstrate air is real—and powerful.
Virginia Department of Education
Permeability and Porosity
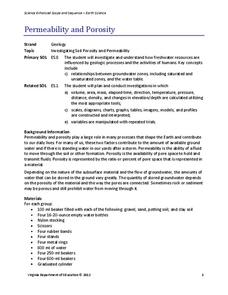
Covering both permeability and porosity, scholars perform a hands-on experiment testing various soil types. The material includes a pre-lesson plan worksheet to help focus pupils on the task at hand.
Curated OER
Typhoon Project
Learners graph and outline the path of a typhoon. In this algebra lesson plan, students measure the path of the typhoon and create a graph with their data. They analyze the data and make predictions.
Curated OER
Become the Meteorologist
Seventh graders analyze the data from Hurricane Tracking maps. In this earth science lesson, 7th graders plot data points on their maps and predict where the storm will most likely hit. They compare their prediction with the actual storm...
Curated OER
Laboratory - Density of a Material
Students conduct a lab (with water, guar gum and sodium borate) and carefully record physical and chemical properties and changes throughout the session, and experiment with weighing by difference.


