Curated OER
Samples and Stats
Young scholars explore different methods of taking surveys and conducting polls and examine these methods for bias. They design and administer a sample survey, analyze the data and present their findings to the class.
Curated OER
Favorite Foods at Thanksgiving
Fourth graders study different types of graphs as a means of displaying information. They survey others to find their favorite Thanksgiving food and then graph the results using different types of graphs.
Curated OER
Bias in Statistics
Students work to develop surveys and collect data. They display the data using circle graphs, histograms, box and whisker plots, and scatter plots. Students use multimedia tools to develop a visual presentation to display their data.
Curated OER
The Human Line Plot
Fifth graders collect data and use charts and line plots to graph data. Through class surveys, 5th graders collect data concerning a particular subject. They graph their data using a line graph. Students make inferences and predictions...
Curated OER
Kids Count
Students read special purpose map, use place value to hundred thousands, and write numbers to hundred thousands.
Curated OER
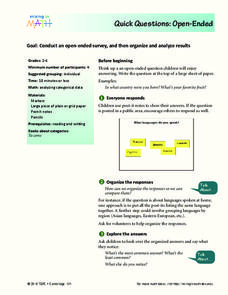
Quick Questions: Open-Ended
Students conduct an open ended survey and analyze the data they found. In this open-ended survey lesson plan, students ask others their open ended questions and then organize their results based on the most common, least common, and...
Curated OER
Understanding Radios
Fifth graders explore ratios. Using models and real-world scenarios, they complete tables and generate comparisons. Pupils demonstrate multiple ways of writing ratios and describe the differences between ratios.
Curated OER
Pie Charts
The teacher conducts a survey of each student's favorite color. The teacher then creates a pie chart identifying the information gathered. The students display mastery by creating their own pie chart displaying the same information.
Curated OER
Taste Test
Third graders practice creating bar graphs by conducting a taste test. In this graphing lesson plan, 3rd graders taste several different brands of peanut butter and discuss among their classmates which tastes better. Students...
Curated OER
Calculating Buttons
Students, after reading "The Button Box" by Margarette S. Reid, analyze real-world data by surveying a sample space. They predict the generalization onto a larger population utilizing calculators and computers. Students total categories,...
Curated OER
Money Circulation: A Story of Trade and Commerce
Students are introduced to the meaning, symbolism, and value of the quarter. They determine the percentage of total monetary value held in quarters and graph the results. Students infer about the U.S. Mint's distrubution of coins. They...
Curated OER
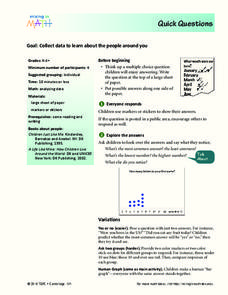
Quick Questions
Students ask their classmates survey questions. In this survey lesson, students come up with a question and possible answers. Their classmates mark their answers and the class discusses what they notice.
Curated OER
Our Favorites
Pupils participate in and conduct a survey to determine various class favorites. They collect, organize and display their data, interpret the results, and complete a packet of worksheets to display the information.
Curated OER
A Measure of Happiness
Students share opinions about the factors that contribute to or detract from their happiness. They create survey to determine how people in their community measure happiness, and write reflections on the relationship between money and...
Curated OER
Picture Graphs
First graders work with picture graphs, create their own individual graphs, and construct and read graphs.
Curated OER
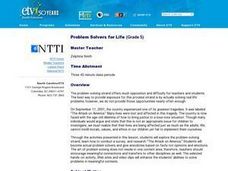
Problem Solvers for Life
Fifth graders identify and explore the components of solving a problem. Students conduct a survey to collect, analyze and interpret data based on a given problem. Also, 5th graders use a variety of strategies to solve math problems,...
Curated OER
6 Poisson Distributions
Students explore the concept of poison distributions. In this poison distribution instructional activity, students construct poison distributions by surveying the number of cars that pass a point in a specific amount of time. Students...
Curated OER
Thinking About Credit
Middle schoolers explore the concept of credit. In this credit lesson, students discuss what it means to buy items using credit. Middle schoolers discuss how interest accrues and how much is really being paid with a credit card. Students...
Curated OER
Class Time Capsule
Students record and graph information about themselves and the class. They put the information in a time capsule that they reopen at the end of the year.
Curated OER
Graphing Favorite Holidays
Young scholars create spreadsheets and bar graphs based on results of survey of favorite holidays.
Curated OER
SkittleGraphs
Second graders discover how to make a bar graph. Each student receives a bag of Skittles candy. They make a bar graph which documents the colors found in the bag. At the end of the lesson, the Skittles are eaten. Fun!
Curated OER
Health/Wellness Interdisciplinary Unit
Students examine human body systems, research a disease or condition, analyze their family trees to look for health conditions and/or diseases which may be prevalent, discover ratio and proportions of human body, and read novel, The...
Curated OER
Statistical Pictures of School and Life
Students explore how mathematical data is used to summarize and illustrate everyday life. They apply mathematical concepts and skills to analyze data. Students conduct a five question survey of 50 people or more and graph the data.
Curated OER
Mr. Cobbler's Shoe Dilemma
Students employ statistics to solve real-world problems. They collect, organize and describe data. They make inferences based on data analysis. They construct, read, and interpret tables, charts and graphs.


