Curated OER
Agriculture, Weather, Economy and Indiana
Fourth graders, in groups, investigate the role of weather in Indiana's farming economy. They make a prediction as to weather and its effect on the economy of Indiana. They present their data using a media presentation of data...
Curated OER
The Big Crush
Middle schoolers examine weather maps from their state from the past few days. They examine the Highs and Lows on the maps to determine what kind of weather they produce. They use that information to better prepare for their activities...
Curated OER
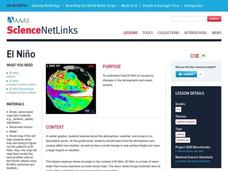
El Nino
Explore the properties of water and the affects of El Nino. Middle schoolers will learn about the devastation an El Nino can cause as well as the definition of El Nino. Additionally, they will discover the cause of El Nino along with the...
Curated OER
Measuring Precipitation
A little engineering design is mixed into this lesson on precipitation measurement. Groups plan and construct a rain gauge, and use it to collect precipitation. As part of the PowerPoint presentation, learners view a satellite map of...
Curated OER
Strawberry Girl: Life on the Frontier
Students explore geographic changes by researching the state of Florida. In this Florida history lesson, students identify the storms and disasters that have created sinkholes in portions of Florida. Students read the book Strawberry...
Curated OER
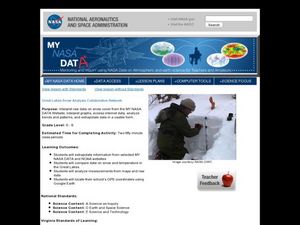
Great Lakes Snow Analysis Collaborative Network
Learners interpret data on snow cover and analyze trend patterns. In this snow lesson plan students compare data and locate their school's GPS coordinates.
Curated OER
Analyzing Meteorological Data From Mars
High schoolers compare real-time Earth and Mars measurements for temperature, wind speed, humidity and atmospheric pressure by accessing Internet-data resources from NASA. They access real-time weather data and maps for their school...
Curated OER
Scientist Tracking Network
Young scholars correlate surface radiation with mean surface temperature of several geographic regions. They observe how these parameters change with latitude and construct an understanding of the relationship of solar radiation to...
Curated OER
El Nino
Young scholars explain what El Nino is, where it is located and how it is created. They describe the weather changes caused by El Nino. They draw the patterns of El Nino on a world map. They predict economic effects El Nino has on the...
Curated OER
Clouds
Young scholars observe and record different types of clouds. They use a cloud chart to discuss the three cloud types to see if students can identify the clouds they drew.
Curated OER
Science: Hurricanes As Heat Engines
Students conduct Internet research to track the path of Hurricane Rita. They record the sea surface temperature of the Gulf of Mexico during and after the hurricane and draw conclusions about how hurricanes extract heat energy from the...
Curated OER
Coral Bleaching in the Caribbean
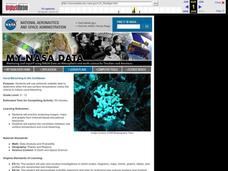
Students use authentic satellite data on the NASA website to determine when the sea surface temperature meets the criteria to induce coral bleaching.
NOAA
Currents
Learn how ocean currents are vital to humans and marine life. The eighth installment of a 23-part NOAA Enrichment in Marine sciences and Oceanography (NEMO) program, focuses on ocean currents and how they affect global climate. The...
Curated OER
Science: What Is a Barometer?
Fourth graders discover how barometers help to predict the weather. Using newspapers, they examine the weather forecast and determine the meaning of high and low as they pertain to pressure. After making cluster diagrams, 4th graders...
Curated OER
The Bulbs: Camas and Daffodil
Fourth graders become aware of the importance of the camas bulb to the Nez Perce people, they learn the parts of plants, and gain understanding of the interdependence of Nature. They study about the possible causes and outcomes of global...
Curated OER
Temperature and Daily Life: Mexico City and Indianapolis
Learners compare the effect of temperature on daily life of a citizen in Mexico City, Mexico with that of a citizen of Indianapolis, Indiana.
Curated OER
Introducing The Gulf Stream
Sixth graders research the average temperatures of different places on Earth. In this earth science lesson, 6th graders explain how the sun's heat cause ocean movement. They discuss how temperature change affects the weather we experience.
Curated OER
Geological Forces and Topography
Students discuss and research the Earth's geological processes. In this geology activity, students study maps of Utah and the United States to learn about geological features. Students then complete the research cards for each area of...
Curated OER
Rain Shadows and Sea Breezes
Students plot the average rainfall for a variety of cities in the United States. Using the map, they work together to determine patterns on which toxicants are transported through the air. They determine the impacts of various weather...
Curated OER
Climate Patterns across the United States
Young scholars articulate differences between climate and weather using examples in a written statement. Using climate data from across the country, they describe climate patterns for various parts of the United States on a map. Students...
Curated OER
European Climates
Ninth graders study the climate regions of Europe. In this geography skills lesson, 9th graders determine how weather and climate are influenced as they research the climate zones of specific locations and write about the ways that...
Curated OER
The Grand Canyon
Fourth graders study the Grand Canyon. They research the Grand Canyon and locate the Colorado River on the map of Arizona. They discuss erosion and read how sedimentary rock was formed. They view photographs of the Grand Canyon and...
Curated OER
Cold Fronts
High schoolers determine its' direction of movement, and list at least five weather conditions associated with the specific front, given animations of several atmospheric variables during a cold front passage. They list at least three...
Curated OER
Trends of Snow Cover and Temperature in Alaska
Students compare NASA satellite data observations with student surface measurements of snow cover and temperature. They practice data collection, data correlations, and making scientific predictions.

