Curated OER
Tally Marks
In this mathematical worksheet, students practice mastering the concept of keeping up with tally marks in a variety of activities. Students complete a survey involving tally marks.
Curated OER
Favorite Days of the Week
In this bar graph worksheet, students use the blank graph to survey classmates and record their favorite day of the week. Students think of one question about the graph and write it on the line.
Curated OER
Off the Hook Books
Students complete a survey that gives their teacher an idea of their reading habits and favorite books. The teacher will use the survey in order to build a classroom library that appeals to all students.
Mathed Up!
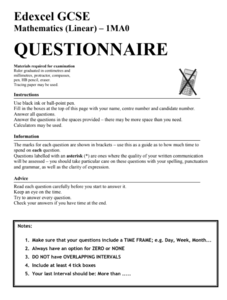
Questionnaires
Check the appropriate box. Class members determine whether a questionnaire is an appropriate one. The portion of the General Certificate of Secondary Education math assessment review requires pupils to create a valid questionnaire to...
US Department of Commerce
Make Data Speak
Data displays are more than just a bunch of numbers. Small groups access census results and create eye-catching data displays. Teams choose a statistic and collect data points for five locations. Classmates present their infographics to...
US Department of Commerce
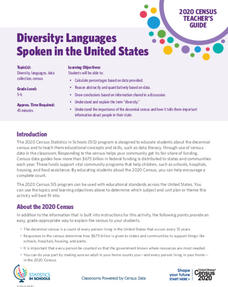
Diversity: Languages Spoken in the United States
High schoolers begin a discussion on diversity and determine the percent of the population that speak another language at home in the US. Classmates make a prediction of the percentage of people that speak another language at home in...
Curated OER
How Do You Like Your Eggs?
First graders conduct a poll about how people like their eggs. In this graphing lesson, 1st graders collect data about how they like their eggs. Students use a picture of themselves to place under the type of egg they like. Students then...
Curated OER
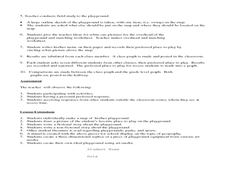
Where Oh Where on the Playground, Do I Love To Be?
Students listen to poem, Where Oh Where On the Playground, Do I Love to Be?, and practice reading, interpreting, and making maps, charts, and graphs in surveying classmates and discussing their favorite places to play in school playground.
Curated OER
School-Wide Recycling
Students investigate recycling. For this environmental lesson, students design a recycling program for their school. Students collect data about how much recyclable materials they use in one week. Students also survey classmates about...
Curated OER
Do You Live in The Country Or in the City?
In this math worksheet, students participate in a group graphing project. Students survey classmates about where they live and plot the results on a bar graph.
Curated OER
Como llegas a la escuela?
What is the most popular way to get to school? Have students interview their peers to discover how and when they get to school. Then learners will graph the results. Consider providing statistics from other classes for your older...
PBIS World
Forced-Choice Reinforcement Menu
Find the best way to appeal to the kids in your class with a positive reinforcement survey. Using forced choices, they decide which of two options would be better for them, based on adult approval, peer approval, independent rewards,...
Curated OER
Many Ways to Represent Our Data
Demonstrate several ways to represent data with your class. They will use surveys to gather data and display the data using tally charts and graphs. Then answer questions according to the data.
Curated OER
Data Collection and Presentation
Middle and high schoolers collect and analyze data from four different activities. The activities include information about classmates, tallying colors of cars in a parking lot, stem and leaf plots, and making a histogram from winning...
Advocates for Human Rights
Creating a Welcoming School and Community
The final activity in a unit study of immigration and human rights asks class members to design a project for their school that builds support for immigrant classmates. To prepare for this project, individuals use what they have learned...
Curated OER
Find Someone Who...
In this ESL survey worksheet, students collaborate with classmates to get to know each other by asking 7 questions. Students write down the names of classmates who answer "yes" to the questions about personal experiences and preferences.
Curated OER
Favorite Food Graph (Blank)
In this math instructional activity, learners create a bar graph to display the results of "your Favorite Food Survey." The graph is not labeled but has spaces for all the choices.
Curated OER
Find Someone Who (Routines)
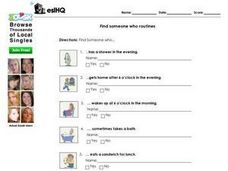
In this ESL conversation worksheet, students circulate among classmates and ask 7 questions. Students find someone who fits the criteria in each question. Example: Find someone who wakes up at 6 o'clock in the morning.
Curated OER
Find Someone Who..
In this ESL conversation learning exercise, learners mingle with classmates to find names of students who can answer "yes" to one of the 25 questions. All questions have the words "got" or "get."
Curated OER
Data Analysis Digital Display
Students create a survey online. In this math lesson, students graph survey data using flisti.com. They share and analyze their classmates' histogram.
Curated OER
Data From Interviews
Students create and conduct a survey about favorite foods, gather and represent the data, interpret data and make predictions to present to the class. They create and use interview questions to gather data. Pupils are explained that...
Curated OER
Simple Bar Graphs Using Excel
Middle schoolers create original survey questions, and develop a bar graph of the data on paper. They input the survey data using two variables onto an Excel bar graph spreadsheet.
Curated OER
Getting to Know You
Students create survey questions for their classmates. In this survey lesson, students pick a yes or no question and find what fraction of the class responded yes. They discover how the wording of a survey question can affect the answer.
Curated OER
Do What You Water: Natural Inquirer
Students investigate water resources on Earth by reading a science magazine. For this natural resources lesson, students read an article in the Natural Inquirer dealing with the scarcity of fresh water. Students complete a survey...


