Curated OER
Collecting Data to Learn About the People Around You
Human graphs, anyone? Did you eat fruit today? What is your favorite costume? Have your K – 6 learners graph the responses. Early elementary grades may count and compare while upper grades compare responses of different groups or make...
US Department of Commerce
Immigration Nation
People come and people go. Given tabular census data on the annual number of immigrants from four different regions of the world between 2000 and 2010, pupils create double bar graphs and line graphs from the data. They analyze their...
Curated OER
Making Graphs
Young scholars explore statistics by conducting class demographic surveys. In this graph making lesson, students identify the family members of each classmate, pets they own, and favorite activities. Young scholars organize their...
Curated OER
Fire Safety Survey
Students collect data regarding fire safety and create a graph. Working in small groups, they administer a survey to family and friends regarding their attitudes toward fire safety. After data has been gathered, students graph their...
Curated OER
Local Traffic Survey
Students conduct a traffic survey and interpret their data and use graphs and charts to display their results.
Curated OER
A Thanksgiving Survey
Students take a survey then use the information gained from the survey to help plan a typical Thanksgiving dinner for our last day of class. They create a graph which corresponds the the data gathered during interviews.
Curated OER
Money Circulation: A Story of Trade and Commerce
Learners are introduced to the meaning, symbolism, and value of the quarter. They determine the percentage of total monetary value held in quarters and graph the results. Students infer about the U.S. Mint's distrubution of coins. They...
Curated OER
The Gathering and Analysis of Data
Young mathematicians gather data on a topic, graph it in various forms, interpret the information, and write a summary of the data. They present their data and graphs to the class.
Curated OER
How Different Are We from Other Students?
Fifth graders make bar graphs from data that they have collected. They have been writing to pen pals in Spain for a couple of months and received a survey back from them. They put all the data together that they collected.
Curated OER
How Tolerant Are Kids in Your School?
Students graph results of a survey about attitudes and tolerance in their school. They discuss the social climate of their school. Students complete a questionnaire, and tabulate the raw data from their class. They create a bar graph...
Curated OER
Surname Survey
Learners use data from the U.S. Census Bureau to determine whether last names in a local phone directory reflect the Census Bureau's list of the most common surnames in the country. In this surnames lesson plan, students use the Internet...
Curated OER
Chocolate Preferences Voting and Graphing Techniques
Students practice sampling and graphing techniques. In this data collection and interpretation lesson plan, students write and conduct surveys about chocolate preferences and then collect their data. Students graph the data in order to...
Curated OER
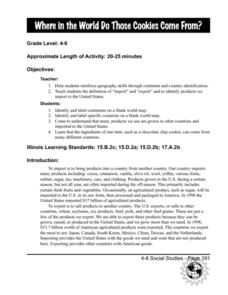
Where in the World Do Those Cookies Come From?
Learners discuss exports and imports by discovering where the ingredients come from for making chocolate chip cookies. They take a survey of their favorite cookies and create a bar graph to represent the information.
Curated OER
Black History Project
Third graders explore and analyze about famous African-Americans by listening to four picture book biographies. They generate a list of 15 famous African-Americans and then create a survey to rank them according to importance of...
Curated OER
Language Arts: Lewin Project
Fourth graders read and respond to the poem, "When I Am Angry." They complete surveys by analyzing the most common feeling and draw a bar graph of their behavior, using different colors to identify the duration of various feelings. ...
Curated OER
Number of Cell phones in Use Per Household
In this cell phones worksheet, students study a bar graph of the number of cell phones usage in households. Students answer 5 questions about the graph.
Curated OER
Math & Social Science
Learners are given data and are to calculate averages and yearly totals of how many cars travel the Tacoma Narrows Bridge. They also make a graph of the data.
Curated OER
Whose Breakfast isn't for the Birds?
Students explore coffee production. In this cross-curriculum rainforest ecology lesson, students research regions where coffee comes from and investigate how the native birds in the rainforest are effected by coffee production. ...
Curated OER
Surveying the Land
Students explore the different kinds of maps and the purpose of each. In this Geography lesson, students work in small groups to create a map which includes the use of a map key.
Curated OER
The Election Connection
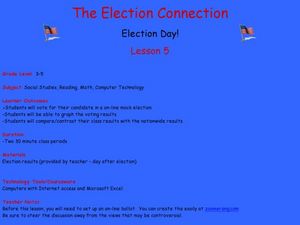
Students participate in a mock election. In this election lesson, students vote online in a mock election, graph the results, and compare their results to the nationwide results.
Curated OER
Savings and Stocks
Work together to brainstorm answers to different questions related to the savings of American people. Draw a bar graph representing stocks. Practice using new economic terms as well.
Curated OER
Hearing Handicap
Students examine the effects of hearing loss. In this lesson on physical disabilities, students survey five older adults on hearing impairments. Students pool their data and compare their results with the results from other studies about...
Curated OER
Where the Buffalo Roam
Learners lear about energy, energy efficiency and consumption. They measure energy use, graph the date, write a letter then design and present a PowerPoint on the topic.
Curated OER
Technobiz
Students examine candy preferences to create a plan in order to improve candy sales. In this technobiz lesson, students build spreadsheet and organizational skills by graphing and calculating data. Students are introduced to terminology...


