Curated OER
Survey of Height
For this data collection worksheet, students survey the heights of their fellow classmates, organize their data in a data table, and create a bar graph from their data. Once bar graph is completed, students complete 2 short answer...
Curated OER
Data Collection
Students write a journal exercise that relates to pets. They collect information from each other in order to practice making and interpreting bar graphs. They Continue building different kinds of graphs with the group.
Curated OER
Regents High School Exam: Living Environment 2008
Tne New York Regents High School Examinations are comprehensive and include various styles of questions, includingmultiple choice and the analysis of graphs. This particular version, the 2008 Living Environment exam surveys a variety of...
Curated OER
Fast Food Survey Using Bar Graphs
Second graders create a bar graph to pictorically represent the data collected from a survey of students. They use Excel to electronically create the graphs and data tallies. They then interpret their data using sentences to explain.
Curated OER
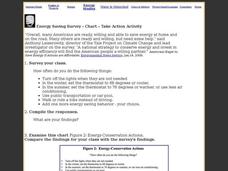
Energy Saving Survey - Chart - Take Action Activity
In this saving energy worksheet, students survey the class about saving energy, examine an energy chart, and answer short answer questions. Students complete 4 tasks.
Curated OER
Environmental Agents of Mathematics: Mathematics for Change
High schoolers analyze environmental science data using Math. They do research about renewable energy, gather data, create graphs and interpret their findings. Then the group presents their arguments persuasively using their findings to...
Curated OER
Rubber Band Banza
Third graders review ideas about sound and vibration to make their own stringed instrument. They review what a pictograph and bar graph are. Pupils conduct a survey within the classroom to choose the four favorite string instruments and...
Curated OER
Surveys and Samples
For this surveys and samples worksheet, students discover data collection techniques and write their own survey questions. Students use random sampling, convenience sampling, and systemic sampling and analyze their results.
Curated OER
Science Survey
In this science survey learning exercise, students think of a survey question to give to their classmates, create a data table to record responses, and then graph the results to their question. This learning exercise has 4 fill in the...
Curated OER
Energy Audit
Students collect data about energy usage and use mathematical calculations to analyze their data. In this energy conservation and statistics math lesson, students survey their homes to complete an energy usage worksheet. Students...
Curated OER
Opinion Surveys
Students examine the factors that affect the accuracy of opinion surveys. They calculate probability and chance using data they have collected. They practice reading tables and graphs as well.
Smithsonian Institution
Vaccines! How Can We Use Science to Help Our Community Make Decisions about Vaccines?
Uncover the fascinating world of vaccines in a multifaceted activity. Investigators explore community perception and the science of vaccines with eight tasks. Scientists continue their studies by giving and reviewing surveys, analyzing...
Curated OER
Give Me A Break!
Students create and conduct a survey. In this broken bones lesson, students discuss if they've ever broken a bone and how a broken bone heals. Students generate questions for a survey on broken bones and healing time, conduct the survey...
Curated OER
Manatee Awareness Survey
Students examine the public's awareness of manatees by taking a survey. They display the results of the survey as a graph.
Curated OER
Go The Distance Car Construction
Students build and program a car to drive a specific challenge distance.They must at the end of the lesson, have the car that stops the closest to a challenge distance.
Michigan State University
Bug Lyphe!
Introduce ecology classes to biodiversity and interdependence in ecosystems with a PowerPoint presentation. Then, they get up-close and personal with the invertebrate world by collecting insects, classifying them, and graphing their...
National Wildlife Federation
Summer Midnight Sun
Sunlight hours and climate have a clear connection. Young researchers collect data about the sunrise and sunset times in an Arctic climate as well as the average temperatures. They then graph their data to make connections between the...
Curated OER
How Many Days Did It Take for Your Bean Seed To Germinate?--class Bar Graph
In this math/science worksheet, students collaborate as a class to create a bar graph which displays the germination time for bean seeds. Students survey their classmates and plot results on a graph.
Curated OER
Applied Science-Science and Math (2A) Post Lab
Second graders create a graph about TV watching. In this bar graph instructional activity, 2nd graders make a hypothesis about how much TV 2nd graders watch per week. They record their TV watching for a week and bring it to school to...
Curated OER
Where's The Beef
Students create and conduct a survey in the community to evaluate the demographics of vegetarians in the community. They compile data, create graphs, calculate percentages, and draw conclusions about the survey data. Students create an...
Curated OER
Kindergarten Class Favorites
Students discuss their favorite foods, a list of four favorite food are compiled on the board or a chart. They each vote for their favorite food and the data is entered onto a spread sheet and a graph is created while the students watch...
Curated OER
And the Survey Says...
Eighth graders evaluate whether a certain argument is valid or invalid. In this science lesson, 8th graders discuss the importance of using unbiased evidence. They design an experiment that they can test in school.
Curated OER
Annual Wetland Plant Diversity Survey
High schoolers locate an area of marsh and, by measuring the total number of individual plants in a sample area, determine whether purple loosestrife population density is correlated to the total plant diversity of the community. They...
SeaWorld
Marvelous Manatees
Here is an interesting lesson on the manatee for your upper graders or middle schoolers. A game is played where learners work together to complete a successful manatee migration. It's a board game, and all of the game components are...


