Curated OER
Statistics and Graphing with Accelerated Math
Young scholars create charts and graphs, using a spreadsheet program, of their results from their accelerated math lessons. Students discover how graphs can be used to interpret data in our everyday lives as well as how several...
Curated OER
Graph a Panther's Diet
Young scholars examine the diet of panthers. In this interpreting data lesson, students collect data on the panther's diet and chart the data in bar and pie graphs.
Curated OER
Dealing With Data
Students collect, organize, and display data using a bar graph, line graph, pie graph, or picture graph. They write a summary describing the data represented and compare the graph to another graph in the class.
Curated OER
Drift Study
Students observe, work with charts, and work with GPS in order to determine the path lobster larvae travel based on local currents. In this currents lesson plan, students work with local fishermen to observe the natural currents.
Curated OER
INFORMATION FLUENCY UNIT
Seventh graders, after defining/brainstorm the task, divide up into groups and are assigned to an alternative energy source (wind, solar, or water) to research. They complete a presentation with visuals on their findings from their...
Curated OER
Multiplication Chart
For this math worksheet, students analyze four multiplication charts. Each chart is illustrated with a different cartoon character.
Curated OER
The Pioneer Experience
Tenth graders consider the move westward. In this Westward Movement lesson, 10th graders compare and contrast the experiences of 2 pioneers by creating t-charts. Students analyze diaries, photographs, and political cartoons that capture...
Curated OER
Apply Pre-reading Strategies and Read Persuasive Text
Students apply pre-reading strategies to improve comprehension of An Account of Sa-Go-Ye-Wat-Ha by Elbert Hubbard. In this literature lesson, students complete K-W-L and T charts based on the readings.
Curated OER
Under the Sea - KWL Chart
Students create a KWL chart to start the discussion on ocean animals. They practice sorting the animals into their different classifications. They use indexes, table of contents and glossary to find information.
Beyond Benign
Plastic Bags
Paper or plastic? Explore the environmental effects of using plastic bags through mathematics. Learners manipulate worldwide data on plastic bag consumption to draw conclusions.
Curated OER
Motivating the Students
Teachers explore various ways to motivate students. They consider star charts and effort charts to create a point system for motivation. They explore setting goals, progress markers, questionnaires, feedback sheets, and personalizing...
Curated OER
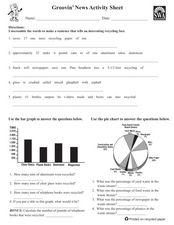
Groovin' News Activity Sheet
In these recycling worksheets, students complete several activities to learn about recycling. Students complete a word search, word scramble, bar graph, pie chart, research project, class project, and individual project for recycling.
Curated OER
Race into Fluency!
Elementary learners practice reading short passages to increase their fluency. They work in pairs to do repeated readings of Jane and Babe, recording their times. They switch roles and time one another in an effort to decrease the amount...
Curated OER
Understanding Connotation
Lincoln's "Gettysburg Address," which is available online, is used in the language instructional activity presented here. Middle schoolers read through the text for comprehension. Then, they reread the first paragraph and identify all...
Curated OER
Sweet Data
Students input data about the colors of their serving of M&M candies onto a spreadsheet. They create charts and graphs based on this information.
Curated OER
The Gas Laws
A couple of gas law charts and the history of the gas laws constitute this presentation. Notes are included for the slide that illustrates how to perform gas law calculations. This is a simple collection, a visual aid enhance to your...
Curated OER
Data Analysis: For Little Learners
Using pictographs, tally charts, and surveys, kids learn all about data analysis and collection. They make surveys, collect data, then construct pictographs and tally charts to organize their information.
Curated OER
History of English
Providing both a history of English before England (Sino-Tibetan, Finno-Ugric, Hamido-Semitic, Indo-European) and a history of English in England, this presentation includes charts and many examples of the changes in the English language...
Curated OER
Fahrenheit 451: KWHL Strategy
Turn your readers into "examiners, critics, knowers, and imaginative creators," with a KWHL strategy designed for Fahrenheit 451. Individuals fill out a KWHL graphic organizer about censorship and then share responses with a group. The...
Curated OER
Student Designed Investigations Part 4 - Poster Presentations/Science Fair
Third through fifth graders prepare posters to present at a science fair. Working with a partner, pupils conduct investigations and prepare a poster to present their findings. They rehearse their presentations, and add visual aids;...
Curated OER
English Cognates in Various Indo-European Languages
Studying the history, influences, and cognates of the English language, this presentation provides students in linguistics and language classes with several charts of information on cognates from languages around the world. The slideshow...
PBS
Measuring Waves | UNC-TV Science
Discover the secrets used by scientists to measure mechanical waves. Young physicists learn about measurable wave qualities—amplitude, wavelength, and frequency—by watching and listening to a video discussing longitudinal and transverse...
Curated OER
Scientific Method
In this science worksheet, students identify and locate each of the words to the right in the word search puzzle on the left. Then they list as many words as they can from the letters in scientific method.
Curated OER
Using A Table
In this table activity, students observe information in a table, and then answer ten questions pertaining to the information. They must correctly read a table in order to arrive at the correct answer. Questions pertain to features of a...
Other popular searches
- Math T Charts
- Blank T Charts
- T Charts in Math
- T Charts to Solve Problems
- T Charts in Science
- T Charts Multiplication
- Functions and T Charts
- T Charts for Prewriting
- Accounting T Charts
- Graphing With T Charts
- Small T Charts
- Using T Charts


