Curated OER
Word Search Y3 Data
In this word search worksheet, learners find the words in the word search and then circle them. There are 16 words in the word bank for students to locate. They then try to find any other words that they can. The answers are on the...
Curated OER
Integers in the Weather
Middle schoolers engage in a clever lesson that combines meteorology with mathematical thinking. They use integers in relation to high and low temperatures that they record. They use a spreadsheet of weather data, a computer, and gain...
Curated OER
Tallies Tell It All
Students count a number of objects and create a tally with groupings of five to illustrate their total. They identify a number of things both at school and at home that can be counted with tallies and create appropriate tallies for each.
Curated OER
Be the Kiwi: Gender Roles
Students take a look at gender roles in New Zealand. In this global issues lesson, students analyze statistics that reveal the divide between men and women employees in the country.
Curated OER
Favorite Sports Graph
In this data collection and graph worksheet, students ask each classmate which sport is their favorite based on the ones shown at the bottom of the graph. They color a square for each response, and tell the most and least popular sport.
Curated OER
IT IS ABOUT SUPPLY AND DEMAND.
Students learn that the price of an item is defined by its supply and demand. In this lesson students graph the relationship between demand and supply of various products, students also consider hidden costs.
Curated OER
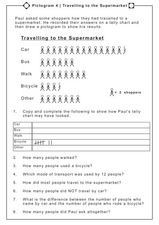
Pictogram 4: Traveling to the Supermarket
In this creating and comprehending a tally chart instructional activity, students use a pictograph to tally the number of ways people traveled to the supermarket, tally the results, and answer comprehensive questions. Students answer 8...
Techbridge Curriculum
Calculating Rainwater Runoff
Thirsty plants soak up every bit of a rainfall, but what happens to the rain that hits the roof? Calculate the amount of rainwater from your school's roof with an Earth science activity, which brings measurement skills, observation...
Curated OER
Graphing Words Word Search
In this data vocabulary worksheet, students search for 16 graph-related words in a word search grid. Each word relates to graphing and collecting data.
Curated OER
Bunny Cakes and Graphing
Third graders graph and analyze data relating to the book "Bunny Cakes" by Rosemary Wells. They listen to and discuss the book, vote on their favorite cake using Excel computer software, and discuss the results.
Curated OER
The Effect of Temperature on Solubility
In this solubility worksheet, students conduct an experiment to see how temperature effects the solubility of salt in water. Students record their data in a chart and then graph the results. Then students complete 2 short answer questions.
Curated OER
Survey and Tally
Second graders view a model of a survey and tally. In this survey and tally lesson, 2nd graders decide on questions for a survey. Students conduct the survey and tally their results. Students create a tally chart. Students view a...
Curated OER
Analyzing Intertidal and Deep Sea Vent Communities
Students study how scientists measure diversity. In this diversity lesson students look at marine communities and look at data to calculate diversity in 3 different ways.
Curated OER
Don't Lose Your Load!
Students create graphs using collected data. In this algebra instructional activity, students use spreadsheet in Excel to create graphs to interpret their data and make predictions. They rewrite word problems using algebraic expressions.
Curated OER
Using Graphs and Charts
Students complete T charts and manipulate numbers using graphs and charts. In this math graphs and charts lesson, students review the concepts of pattern and function. Students then complete practice pages where they manipulate numbers...
Curated OER
Invasion of the (Cactus) Booty Snatchers
Students, in groups of four,identify and analyze relationships among birds within a population, a community and an urban ecosystem. They fill out, while they're completing their experiments, a Populations of Birds Student Data Sheet.
Curated OER
Place Value Chart
In this math worksheet, students understand that the position of a digit determines its value. Students examine a place value chart from ones to hundred billions. There is room to separate a number, write it in words and write it in...
Curated OER
Which Car Should I Buy?
Students use gas mileage of different cars to create T charts, algebraic equations, and graphs to show which gets better mileage. In this gas mileage lesson plan, students use the graph to see which car they should buy.
Curated OER
How Do Astronomers Measure Distances to Stars?
In this astronomy worksheet, students participate in an activity using the parallax effect to measure star distances. They record their information in a data table then complete 5 fill in the blank conclusion questions.
Curated OER
Bar Graphs
In this bar graphs worksheet, learners, working with a partner, explore how to read and analyze the five answers to one mathematical bar graph.
Curated OER
Fine Arts in School
In this math chart worksheet, students use the chart to answer the questions. The information on the chart is about students who participate in fine arts.
Curated OER
Understanding Statistics
In this statistics worksheet, learners examine and interpret pictographs and line graphs. Students analyze the provided data in order to create bar graphs, circle graphs, and box and whisker plots. The nine page worksheet accompanies a...
Curated OER
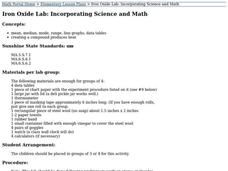
Iron Oxide Lab: Incorporating Math and Science
Students conduct an experiment in small groups, draw conclusions about the amount heat of a compound achieves and practice their data analysis skills.
Curated OER
Graphing Regions: Lesson 2
Students identify and analyze geographical locations of inventors. They each identify where their inventor is from on a U.S. map, discuss geographic patterns, and create a t-chart and graph using the Graph Club 2.0 Software.


