Curated OER
Reel in Learning with Reptiles
Whether it’s all about a Jackson Chameleon or a North American Bearded Lizard, learners will be eager to embark on informational text with reptiles.
Curated OER
Likely Outcomes
A coin toss is a simple and fun way to help youngsters discovery probability. Preferably in partners, they first predict what would happen if they tossed two coins 48 times. How often would two heads show up? Two tails? How about one of...
Curated OER
Measuring Volume/Capacity Using the Metric System
There is more than one way to measure an amount, as learners discover by applying multiple measurement tools in these activities. Centimeter cubes, cylinders, beakers, and measuring cups are used to find the volume of regular and...
Curated OER
Volume, Mass, and Weight
Study the difference between mass and weight. Your math group will compare the weight of an item to the amount of space that it uses. They'll then use conversion factors to find the difference between kilograms and pounds. Essential...
Curated OER
Data Analysis Challenge
In this data analysis worksheet, young scholars work with a partner to collect information for a survey. The information is then compiled into a graph. Students must indicate their survey question, the target audience, predict the...
Curated OER
Many Ways to Represent Our Data
Demonstrate several ways to represent data with your class. They will use surveys to gather data and display the data using tally charts and graphs. Then answer questions according to the data.
Curated OER
Build a Bar Graph
Learners discover how to use bar graphs. They will gather and organize specific data in order to put it into a bar graph. Then they will answer several questions based on the information they have graphed.
Curated OER
Yummy Math
Young mathematicians use bags of Skittles to help them gain practice in graphing and organizing data. They work in pairs, and after they have counted and organized their Skittles, they access a computer program which allows them to print...
Novelinks
Man's Search for Meaning: ReQuest Procedure Questioning Strategy
As part of a study of Viktor Frankl's Man's Search for Meaning, class members respond to, and craft, higher-level comprehension questions based on passages from the text.
National Security Agency
Starting a Restaurant
Through an engaging unit, chefs-in-training will sort and classify data using tally charts. Learners will also create bar graphs to display restaurant data and interpret data from bar graphs using a variety of categories....
Curated OER
Probability Lesson Plans
Here is an article on how teachers can use probability lesson plans to teach their charges about theoretical and experimental probability.
Curated OER
Some Houses Are Made of Straw, Wood, or Brick: But... This House is Made of Mud...
First graders read and discuss several stories. They share information about different types of shelter around the world. They explain that lifestyles and shelter depend very much on where people live and how they use the resources...
Curated OER
How Big Is Your Smile?
Pupils measure their smile with a piece of string, which is then measured on a ruler (metric of course!). They take a piece of string and cut it to the length that matches their smile and then measure it with a ruler.
Curated OER
Count The Letters
Students perform activities involving ratios, proportions and percents. Given a newspaper article, groups of students count the number of letters in a given area. They use calculators and data collected to construct a pie chart and bar...
Curated OER
Presentation of Quantitative Data- Vertical Line Diagrams
In this quantitative data instructional activity, students examine how vertical line diagrams can be used to display discrete quantitative data. They read about the use of tally charts to create vertical line graphs that display the...
Curated OER
Comparing Data on Graph A and Graph B
Second graders gather and graph data. In this graphing lesson, 2nd graders collect data and graph this information using tally charts, bar graphs, pictographs, or tables. They make predictions about the outcomes.
Curated OER
Graphing
Students investigate graphing. In this bar graph lesson, students view an informational website about graphing, then construct a class birthday bar graph outside with sidewalk chalk. Students choose a survey topic, then collect...
Curated OER
Graphing Data
Second graders graph data about their classmates. In this data analysis lesson, 2nd graders ask each other several questions about their hair color and eye color. Students graph the data that they collected.
Curated OER
A Class Census
Students recognize that data represents specific pieces of information about real-world activities, such as the census. In this census lesson, students take a class and school-wide census and construct tally charts and bar graphs to...
Curated OER
Probability
Sixth graders explore theoretical and experimental probability. In this probability lesson, 6th graders participate in several hands-on activities involving the comparison of theoretical probability to the actual results. Games include...
Curated OER
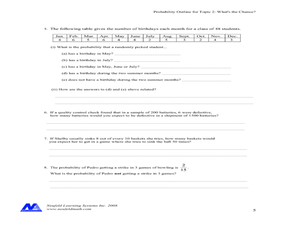
Concept: What's The Chance?
In this concept worksheet, students perform probability experiments. Using collected information, they interpret the data. Students answer questions about probability. This five-page worksheet contains approximately 15...
Curated OER
Johnny Appleseed Origami
Second graders make an origami Johnny Appleseed. In this geometry lesson students follow folding instructions. They find different geometric shapes while they are folding. They create Johnny Appleseed's body and attach a face and hands...
S2tem Centers SC
Investigating Chance Processes of Probability
How likely is it that the school cafeteria will serve chicken tomorrow? Discover the concept of probability with the roll of the dice. Pupils evaluate the liklihood of several statments about everyday life. Then, a mathematical...
Curated OER
Marketing to Teens: Marketing Tactics
Enlighten young consumers to advertising techniques aimed specifically at their generation. Have learners answer questions about how advertisements are geared for a younger audience, then have them practice selling to other teenagers....
Other popular searches
- Tally Charts
- Tally Charts and Pictographs
- Tally Charts and Tables
- Tally Charts or Pictographs.
- Math Tally Charts
- Primary Tally Charts
- Sorting and Tally Charts
- Tally Charts Mode
- Using Tally Charts
- Lucky Charms Tally Charts
- Birthday Tally Charts
- Tally Charts Lesson Plans


