Curated OER
Creating Graphs from Tables
Students interpret data from tables and then create a graph to show the same data in a different organization.
Curated OER
Graphing Data
First graders learn how to display data using a bar graph. In this bar graph lesson plan, 1st graders use data from a t-shirt color survey to make a bar graph. They also make an animal bar graph before interpreting the information.
Curated OER
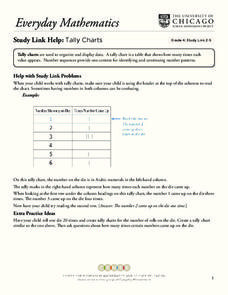
Tally Charts
In this tally charts worksheet, learners discuss how to use a tally chart and how to read the chart. Once students record information on a tally chart they answer questions showing their ability to read a tally chart.
Curated OER
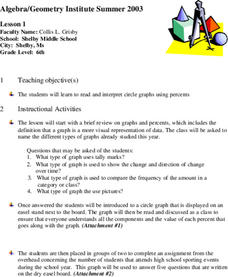
Circle Graphs
Sixth graders participate in a lesson that covers the reading and interpretation of a circle graph. They review the part of a whole concept for percents and student observe and practice using the circle graph.
Curated OER
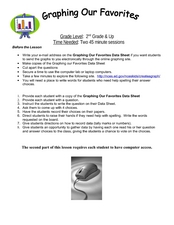
Graphing Our Favorites
Second graders use a computer program to follow directions and graph their favorite things into a bar graph. In this graphing lesson plan, 2nd graders have 30 choices of favorite things to graph.
Curated OER
Favorite And Least Favorite Vegetable Survey and Bar Graph
In this favorite and least favorite vegetable survey, students create a bar graph after they survey and keep track of data on this graphic organizer.
Curated OER
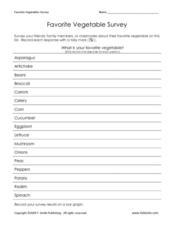
Favorite Vegetable Survey
What's your favorite? Use this chart template in your lesson on data collection and graphing. Learners record classmates' favorite vegetable in a survey, and then graph the results. A labelled graph is provided here- print both pages...
Curated OER
My Test Book: Tally Charts
In this online interactive math worksheet, students solve 10 problems that require them to read and interpret tally chart data. Students may submit their answers to be scored.
Curated OER
Tallying Animals
Second graders draw a picture of a pond scene which includes various animals. They exchange pictures and tally the number of animals drawn. Then they record the number on a chart and write a story about their pictures.
Curated OER
Beatrix Potter Book Survey
In this survey activity, students ask classmates which Beatrix Potter books they have read and record their responses. Book titles are listed in the first column and tally marks are written in the second column. Students then graph the...
Curated OER
Make a Bar Graph
For this bar graphs worksheet, students use the tally chart to make a bar graph. Students color one box for each tally mark and then use the chart to help answer the questions about the sunny, cloudy, and rainy days.
Curated OER
Probability: What's Most Likely?
Work with graphs, tally marks, and probability. Fifth graders read tables with different sets of data, including tally marks and a bar graph, to answer five questions. Use this worksheet as part of a probability lesson, or as a homework...
Curated OER
Thanksgiving Math
In this Thanksgiving theme math practice, students count turkeys and tally. In this fill in the blank worksheet, students find three answers.
Curated OER
The Die Is Cast
Second graders use tally marks to tabulate and count the number of times each number on a die is rolled.
Curated OER
My Favorite Book Survey
In this my favorite book survey worksheet, students survey their classmates to find out what books they enjoyed reading the most during the year. Students record their choices and keep tally marks on their data.
Curated OER
Nutrition Lesson Plan
Second graders complete a survey as class answering the question: "Did you eat breakfast this morning?". They place a tally mark in the column that best represents their answer. They then discuss the results in the graph.
Curated OER
What Are Your Favorite Apples?
In this tally instructional activity, students take a survey to determine the favorite apple. They write tally marks beside the apple chosen. For elementary students, this instructional activity may be used for counting purposes and to...
Curated OER
Make a Tally
In this tally chart learning exercise, students read the word problems and use the information within the problem to make a tally chart. Students use the tally charts to help them finish and solve the word problem.
Curated OER
Run, Gingerbread Men, Run!—Game
Run, gingerbread men! During the board game, four gingerbread men race to discover which one finishes first. Scholars take note of the game's results using a tally chart and bar graph for all to observe the frequency of the winning...
Curated OER
Bar Graphs
Third graders examine the main parts of a bar graph and how to round up to the nearest tenth. They make an example of a bar graph and answer questions based on the graph using a list of state capitals and their average temperatures....
Curated OER
Survey Surfing
Students survey other students and record the information on a chart using tally marks. They record their favorite fish and their favorite foods, and share the results with the class.
Curated OER
Favorite Animal Survey --Animals of Australia
In this favorite animal survey learning exercise, students use tally marks to survey and record data about favorite Australian animals. Students then use the results to make a graph.
Curated OER
Holiday Tally
In this tally chart worksheet, students ask ten friends which of 3 holidays they like best. Students create a tally chart with their results and answer 6 questions.
Curated OER
Quantitative Data
In this quantitative data worksheet, pupils compute measures of central tendency, draw vertical line diagrams, and compare collected data. This 23-page worksheet contains approximately 100 multi-step problems. Explanations and examples...


