Curated OER
Lessons for Atlatl Users with Some Experience-Grade 6
Sixth graders experiment with an atlatl and dart. In this sixth grade data management mathematics lesson, 6th graders explore and determine the most suitable methods of displaying data collected from their experimentation with throwing...
Curated OER
The Write Stuff
Fourth graders share a previously written portfolio piece and the class guesses the genre. Students use tally marks to keep track of how many of each piece there are in class. Once the data collection is complete, 4th graders create a...
Curated OER
Dynamite Data
Second graders rotate through a variety of stations designed to offer practice in manipulating data. They sort, tally and count items and then create bar graphs, tables, and pie graphs to record their findings.
Curated OER
Excel Lesson Plan Coin Statistics
Second graders determine the difference between making a prediction and determining actual information. They design a spreadsheet for a coin flipping activity on which they include their predictions and what actual happens when they flip...
Curated OER
Displaying the Data
Students gather facts about their parent's families through the completion of parent interview forms. Using tally marks, the data gathered is counted, transferred to graphs and used to create family timelines.
Curated OER
Graphing Data
First graders learn how to display data using a bar graph. In this bar graph lesson plan, 1st graders use data from a t-shirt color survey to make a bar graph. They also make an animal bar graph before interpreting the information.
Curated OER
Investigation-What are My Chances?
Second graders explore probability. In this math lesson plan, 2nd graders discuss the possibility of choosing a certain colored tile from a bag. Students perform experiments and describe the outcomes as certain, possible, unlikely and...
Curated OER
Agriculture Counts
Students discuss the kinds of things they count and how to use tally marks. In this social science lesson, students count animal crackers by using tally marks for each kind of animal. The tally marks are changed into numbers and one...
Curated OER
Investigation - What Does 1,000 Look Like?
Second graders determine what 1,000 items look like. In this math investigation lesson, 2nd graders collect 1,000 items and determine the best way to count them by tens and hundreds. They can use stickers on notecards to count to 1,000....
Curated OER
Survey Surfing
Students survey other students and record the information on a chart using tally marks. They record their favorite fish and their favorite foods, and share the results with the class.
Curated OER
Water Cycle: Weather Lesson 1
First graders go on a water walk, collect weather data, and measure rainfall for a month. They examine the water cycle in this series of lessons.
Curated OER
Probabilities for Number Cubes
Students explore the concept of probability. In this probability lesson, students roll a six-sided number cube and record the frequency of each outcome. Students graph their data using a frequency chart and keep tally marks in a...
Curated OER
Many Ways to Represent Our Data
Demonstrate several ways to represent data with your class. They will use surveys to gather data and display the data using tally charts and graphs. Then answer questions according to the data.
Illustrative Mathematics
Comparing Numbers
Young mathematicians spin their way to a deeper number sense with this fun, collaborative activity. Using two spinners, one with the numbers 0-9 and the other with the decades 00-90, pairs of students take turns building and comparing...
Primary National Strategy
Ordering and Counting
Are you in need of a 5-day unit intended to teach little learners how to count to 20? This is a well-structured complete set of lessons which employ a variety of methods to instruct learners about various ways to count from 1 to 20. They...
Curated OER
Pancakes, Anyone?
First graders explore data collecting and graphing. In this data collecting and graping lesson, 1st graders watch a video about monster who sells pancakes. Students make a graph to record the most popular pancake. Students also play...
Curated OER
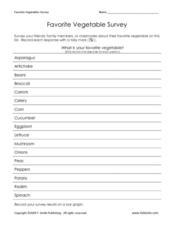
Favorite Vegetable Survey
What's your favorite? Use this chart template in your lesson on data collection and graphing. Learners record classmates' favorite vegetable in a survey, and then graph the results. A labelled graph is provided here- print both pages...
Curated OER
Handling Data: Collecting and Recording Data
Young scholars collect and record data. In this collecting and recording data lesson, students collect data and record that data using frequency tables which include the x and y axis.
Curated OER
Virtual Field Trip
Are we there yet? Young trip planners learn about their state and plan a trip. They will select sites to see in three cities in their state, and record associated costs in a spreadsheet. While this was originally designed as a...
Curated OER
How Many Ways?
Second graders develop number sense. In this number sense lesson plan, 2nd graders use multiple ways to represent numbers including written numerals, tally marks and manipulatives. Students correctly use place value to the thousands place.
Curated OER
Buzzing is BEE-lieving
Students investigate insects. In this insect lesson, students explore various insect models and identify the characteristics of each. Students observe insects outside and tally how many insects they observe.
Curated OER
Recording Frequency
First graders analyze nursery rhymes and gather data about word frequency. In this frequency lesson, 1st graders create graphs and tables. Students interpret the data.
Curated OER
Graphing With Candy
Students gather information and interpret the results using a tally chart, a table, and a bar graph.
Curated OER
Comparing Data on Graph A and Graph B
Second graders gather and graph data. In this graphing lesson, 2nd graders collect data and graph this information using tally charts, bar graphs, pictographs, or tables. They make predictions about the outcomes.


