Curated OER
Hugs and Tallies
Students act out the creation of five tally marks. In this tally mark lesson, students act out how to make tally marks. Four students stand very close together and a fifth student gives them a group hug creating five tally marks.
Curated OER
Count the Tally Marks
In this counting skills worksheet, students examine 6 set of tally marks, count each of the sets, and record the number in each of the sets.
Curated OER
Mathematics Lesson Plan
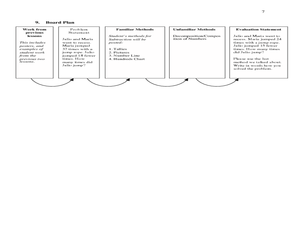
Second graders study subtraction facts. In this mathematics lesson, 2nd graders discuss how to solve two digit subtraction problems. Students recognize that there are many different methods or strategies one can use such as using...
Curated OER
Nutrition Lesson Plan
Second graders complete a survey as class answering the question: "Did you eat breakfast this morning?". They place a tally mark in the column that best represents their answer. They then discuss the results in the graph.
Curated OER
Count and Tally
For this counting skills worksheet, students respond to 4 questions that require them to count items pictured and use tally marks to total them.
Curated OER
Chances And Tallying
In this graphing learning exercise, 2nd graders use tally marks for a coin toss. Students respond to 5 questions about their chart and outcomes.
Curated OER
Tally Marks Activity
In this tally marks worksheet, students write tally marks for object shown. A reference web site is given.
Pennsylvania Department of Education
Freckle Face
Students collect and record data. In this early data analysis lesson, students gather data about their partners face. As a class, the students use tally marks and pictographs to record the data and answer question about the information...
Curated OER
Make a Table
First and second graders participate in an experiment then create a table of tally marks to identify the totals. They problem solve, tally twenty experiences, and generate an answer to one question.
Curated OER
Tally the Objects in the Picture
In this tally the objects in the picture worksheet, 1st graders count the objects in each picture and place a tally mark in the chart as a means of collecting data.
Curated OER
Organizing Data
Third graders investigate ways to organize data. In this tally marking lesson plan, 3rd graders practice drawing tally marks to represent an item of data. Students also make connections with skip counting by fives.
Curated OER
Going Graph-y
Second graders listen to and dicuss the story Where the Wild Things Are. They play a pantomime game and act out various feelings so their classmates can guess. They listen for the frequency of certain words, and record their findings on...
Curated OER
And the Survey Says...
Create a survey and graph! In this graphing lesson, learners listen to a story about pets, create a survey for family and friends about what pets they own, and use the information to create a bar and line graph.
Curated OER
Survey and Tally
Second graders view a model of a survey and tally. In this survey and tally lesson, 2nd graders decide on questions for a survey. Students conduct the survey and tally their results. Students create a tally chart. Students view a...
Curated OER
Graphing
Intended for a faith-based classroom, this lesson requires second graders to create a survey, conduct the survey in multiple classrooms, and graph the results. They can choose between creating a picture or bar graph, or you can require...
Carstens Studios
Math Doodles
Discover the joy and excitement of improving your math fluency through four different puzzles. Combine those with 25 different ways to represent numbers and you have hours of enjoyment that can be fun outside of the classroom as well.
Curated OER
Tallying Animals
Second graders draw a picture of a pond scene which includes various animals. They exchange pictures and tally the number of animals drawn. Then they record the number on a chart and write a story about their pictures.
Curated OER
Probability: What's Most Likely?
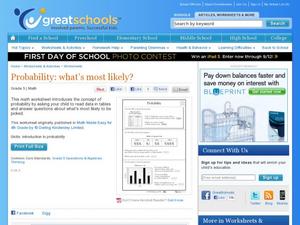
Work with graphs, tally marks, and probability. Fifth graders read tables with different sets of data, including tally marks and a bar graph, to answer five questions. Use this worksheet as part of a probability lesson, or as a homework...
Curated OER
Graphing With Paper and Computers
Fourth graders construct bar graphs. For this graphing lesson, 4th graders create bar graphs in connection with the story, The Copycat Fish. After creating the initial graphs on paper, students use MS Excel to create graphs.
Curated OER
The Die Is Cast
Second graders use tally marks to tabulate and count the number of times each number on a die is rolled.
Curated OER
Make a Tally
For this tally chart worksheet, students read the word problems and use the information within the problem to make a tally chart. Students use the tally charts to help them finish and solve the word problem.
Curated OER
Tally Time
Students create a tally chart. In this math and health lesson, students discuss healthy foods and create a tally chart showing the number of students who like to eat healthy foods.
Virginia Department of Education
Mathematics Vocabulary Cards - Kindergarten
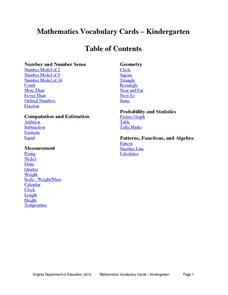
Enhance your math lesson with a series of pictures that illustrate different math concepts. The vocabulary includes a variety of ideas and pictures including fractions, ordinal numbers, picture graphs, and number lines.
Curated OER
Atlatl Lessons Grades 4-12: Lesson for Beginning Users of Atlatl
Sixth graders determine the mean, range median and mode of a set of numbers and display them. In this data lesson students form a set of data and use computer spreadsheet to display the information. They extend of the process by looking...


