Concord Consortium
Gestation and Longevity
Is the gestation length of an animal a predictor of the average life expectancy of that animal? Learners analyze similar data for more than 50 different animals. They choose a data display and draw conclusions from their graphs.
Mathematics Assessment Project
100 People
It's a small world after all. In the middle school assessment task, learners use data that imagines there are only 100 people in the world to answer questions about population demographics. Young mathematicians use ratio and proportional...
Concord Consortium
Fermi Volume
It is about this big. An assessment provides three questions on the estimations of volume. Pupils determine the quantities needed and use dimensional analysis to arrive at estimations involving dollar bills, paint, and gasoline.
EngageNY
Piecewise and Step Functions in Context
Looking for an application for step functions? This activity uses real data to examine piecewise step functions. Groups create a list of data from varying scenarios and create a model to use to make recommendations to increase revenue.
Workforce Solutions
Miniature Gulf Coast Project
Scholars show what they know about data collection and analysis with an activity that examines a smaller population of Houghton, Texas. Independently or in pairs, learners identify their research question, gather, graph, and analyze...
Bowland
Fashionista
So trendy! Show your class how to identify trends in sales patterns using mathematics. Scholars use a software simulation to collect data on age groups, price, and sales at a fashion store. This data allows individuals to determine the...
Kenan Fellows
Least Squares Linear Regression in R
The task? Determine the how effective hospitals are at reducing the rate of hospital-acquired infections. The method? Data analysis! Using an open source software program, individuals use provided data and create scatterplots to look for...
Concord Consortium
Fermi Weight
Wait, there is an estimate for how much that weighs. The resource contains three questions about weight. Using dimensional analysis and benchmarks, pupils determine a reasonable weight for trash, food, and a grain of salt.
Statistics Education Web
Types of Average Sampling: "Household Words" to Dwell On
Show your classes how different means can represent the same data. Individuals collect household size data and calculate the mean. Pupils learn how handling of the data influences the value of the mean.
PBL Pathways
Cell Phones
Calling all subscribers! Model revenue based on individual cell phone subscribers. The project-based learning activity presents a challenge to scholars from a cell phone company. Individuals model data provided to them from the company...
Concord Consortium
Fermi Time
It's all just a matter of time. The resource provides four Fermi questions in reference to time. The questions are open-ended and require classmates to make use of estimation and dimensional analysis.
EngageNY
Modeling with Polynomials—An Introduction (part 1)
Maximizing resources is essential to productivity. Class members complete an activity to show how math can help in the process. Using a piece of construction paper, learners construct a box with the maximum volume. Ultimately, they...
Radford University
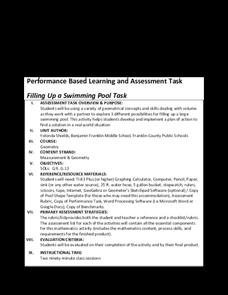
Filling Up a Swimming Pool Task
Swimming pools are no fun without water. For a pool in the shape of a trapezoidal prism, scholars first calculate the amount of water needed to fill the pool. They use experimental data on water flow to determine whether to haul water...
Curated OER
Scatter Plots and Line of Best Fit – TV Task
This handout begins by asking your statisticians to form hypotheses on the correlation between test scores and student height and test scores and the number of hours watching TV. Then using specific data, your class will create scatter...
EngageNY
Mid-Module Assessment Task - Algebra 1 (module 2)
A mid-module assessment uses two multi-part questions to measure progress toward mastery on descriptive statistics standards. Each part of a question addresses a single standard to help determine mastery.
Balanced Assessment
Solar Elements
Let your brilliance shine like the sun. Future mathematicians and scientists consider given data on the abundance of different elements in the sun. The assessment task requires consideration of how these different abundances relate to...
EngageNY
End-of-Module Assessment Task - Algebra 1 (Module 2)
Check for understanding at the end of your descriptive statistics unit with an end-of-module assessment. It uses five questions to measure progress toward mastery of descriptive statistics standards. Each question is developed to address...
Achieve
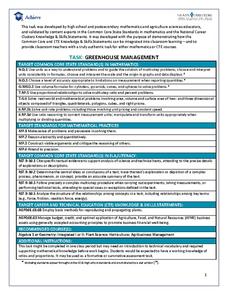
Greenhouse Management
Who knew running a greenhouse required so much math? Amaze future mathematicians and farmers with the amount of unit conversions, ratio and proportional reasoning, and geometric applications involved by having them complete the...
California Education Partners
Science Fair Project
Plant the data firmly on the graph. Given information about the growth rate of plants, pupils determine the heights at specific times and graph the data. Using the information, scholars determine whether a statement is true and support...
Education Development Center
Creating a Polynomial Function to Fit a Table
Discover relationships between linear and nonlinear functions. Initially, a set of data seems linear, but upon further exploration, pupils realize the data can model an infinite number of functions. Scholars use multiple representations...
Project Maths
Correlation Coefficient
Of course, there might be a correlation! Young mathematicians investigate several different data sets, create scatter plots, and determine any correlation. They consider whether a causation exists between any of the variables in question.
Radford University
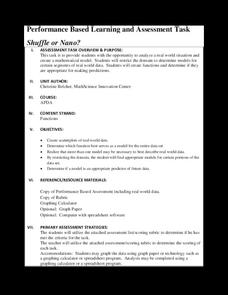
Shuffle or Nano?
Mix up your teaching playlist with a performance-based assessment task. Given iPod sales data for several years, scholars create a scatter plot and perform regression analysis. They determine the best fit curve for different domains.
Radford University
Are We Normal?
Develop a sense of normal. Learners develop two questions to ask classmates to gather numerical data before creating a box and whisker plot and a histogram to display their data. Class members make inferences and investigate the data...
Illustrative Mathematics
Running Around a Track I
The accuracy required by the design and measurement of an Olympic running track will surprise track stars and couch potatoes alike. Given a short introduction, the class then scaffolds into a detailed analysis of the exact nature of the...


