Curated OER
What's Your Speed?
Learners explore the concept of distance v. time. They use a CBR to collect data on their distance over time, then plot their data using a scatter plot and find an equation to model their data. Pupils discuss what if scenarios which...
Curated OER
A Steep Hike
Students explore slope. In this middle school mathematics lesson, students analyze and interpret graphs as they investigate slope as a rate of change. Students use a motion detector to collect data as they walk at different speeds and...
Curated OER
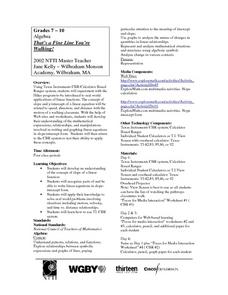
That's a Fine Line You're Walking!
Students experiment with Hiker program to practice real world applications of linear functions and develop their understanding of expressions, relationships, and manipulations involved in writing and graphing linear equations in...
Curated OER
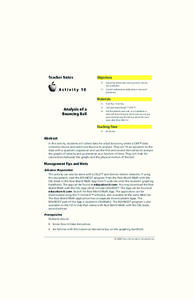
Bouncing Ball Experiment
Students collect data for a bouncing ball and select one bounce to analyze. They explore the relationship between velocity, position and acceleration. They seek out connections between the graphs and the physical motion of the ball.
Curated OER
Investigating Motion
Students determine velocity using the slope of a time distance graph. They investigate a motion cart using a CBR unit and a TI 83 calculator setup. Using the graph generated, they calculate velocity.
Curated OER
Castolon Historic District
Students complete a variety of activities that go along with the study of and possible fieldtrip to the Castolon Historic District in Big Bend National Park, TX.
Curated OER
Skittles and Springs
Pupils experiment to discover the relationship between the stretch of a spring and the amount of weight attached to the spring using Skittles. They use a CBR and a graphing calculator to gather data.


