Curated OER
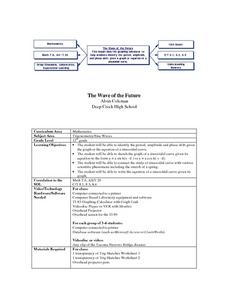
The Wave of the Future
Twelfth graders discuss sine curves and enter equations into their graphing calculator then compare different graphs created on their calculators. They identify the period, amplitude and phase shift given the graph or the equation of a...
Curated OER
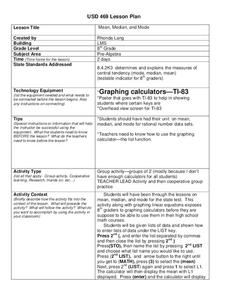
Mean, Median, and Mode
Eighth graders practice using the LIST key on graphing calculators using the proper syntax. They work with the functions of mean, median, and mode in a teacher led lesson and then with a partner on a second data set. They follow...
Curated OER
Electonegativity-How Do Atoms Stick Together?
In this electronegativity activity, students use given electronegativity values for each element to determine the bond type in 9 molecules.
Curated OER
Batteries in Series: Voltage and Light Intensity
Students participate in a hands-on activity to explore the relationship between the number of batteries in a series circuit and its voltage. Students identify the relationship between two variables and plot points on a graph.
Curated OER
Worksheet #2.6: MT-A141 PreCalculus
In this graphing worksheet, students predict how a graph of given functions will work. Next, they check their work using a graphing calculator. Students use algebra to complete the graph of a square and determine transformations.
Curated OER
Modeling With Circular Functions
Learners explore circular functions. They identify the amplitude, period, phase shift and vertical shift of circular functions. Students analyze phenomena described by sine waves and they find mathematical models for transforming images...
Curated OER
Worksheet 2.4/2.5: MT-A141 PreCalculus
In this precalculus worksheet, students use their graphing calculator to graph the domain and range of given terms. They write parametric equations and identify the coordinates of the points on the relation given certain terms.
Curated OER
Measures of Spread
Young scholars explore the concept of measures of spread. For this measures of spread lesson, students calculate the standard deviation for a set of data. Young scholars use the standard deviation to analyze and describe the set of...
Curated OER
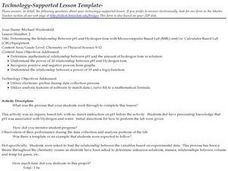
Determining the Relationship Between pH and Hydrogen Ions with Microcomputer Based Lab (MBL) and/or Calculator Based Lab (CBL) Equipment
Students find the relationship between the variables based on experimental data. They determine mathematical relationship between pH and the amount of hydrogen Ions in solution.
Curated OER
Skittles and Springs
Pupils experiment to discover the relationship between the stretch of a spring and the amount of weight attached to the spring using Skittles. They use a CBR and a graphing calculator to gather data.
Curated OER
Bacteria Buddies
Tenth graders grow two different bacteria cultures. They count the colonies, and then use graphing calculators to predict the number of colonies that are going to appear. Students answer questions from their worksheet after completing...
Curated OER
You Gotta Have Heart
Ninth graders investigate the concept of relations and interpret graphs and tables. They analyze given data and look for a pattern to determine if the numbers represent a function. Students practice solving scientific word problems that...
Curated OER
To Drink or not to Drink
Seventh graders discuss water quality, water availability and water resources and how water is used in the world around them. They view a video on water quality then test for pH, temperature and dissolved oxygen to indicate water quality.
Curated OER
The Cricket and The Plant
Students examine determine the symbiotic relationship between plants and animals as the find ways to naturally reduce carbon dioxide emissions. They study the carbon cycle. They work with probe and graphing calculator to examine the...
Curated OER
Periodic Table of Elements
In this chemistry worksheet, students examine the elements and focus on things like the mass and order for the location to match with the type of elements.
Curated OER
Real Estate Lesson: Monthly Payments
Students examine real-world data relating to real estate. They conduct Internet research, record data regarding real estate in major cities, graph the data, calculate mortgage payments using a mortgage calculator, and analyze the data.
Curated OER
Jumping Rope-How Fit Am I?
Young scholars collect data over a 10-week period in their Physical Education class on how many jumps they can do in a minute period or another time period specified by the instructor.
Other popular searches
- Ti 83, Circle Graphs
- Scatter Plots Ti 83
- Ti 83 Circle Graphs
- Graphing Calculators Ti 83
- Graphing Picture With Ti 83
- Ti 83 Calculators
- Ti 83 Statistical Analysis
- Scatter Plot and Ti 83
- Graphing on Ti 83 Calculator
- Calculator Ti 83
- Ti 83 Calculator Worksheets
- Ti 83 Tutorial


