Curated OER
The Barbie Bungee Drop
What do math, bungee jumping, and Barbie® have in common? Young adventure seekers use rubber bands as bungee cords to predict a thrilling, but safe, jump for their doll. First, test jumps are conducted with a few rubber bands. Then more...
Curated OER
A Boxer named Bobo
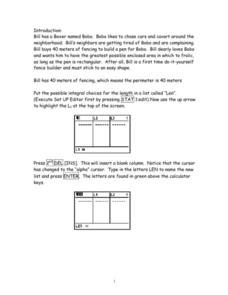
Bobo the Boxer needs a pen and algebra learners need to find the maximum area that can be created from a fixed amount of fence. A graphing calculator is used to assist in their exploration.
Curated OER
Investigating Motion
Young scholars determine velocity using the slope of a time distance graph. They investigate a motion cart using a CBR unit and a TI 83 calculator setup. Using the graph generated, they calculate velocity.
Curated OER
Coming to Know F and C
Students collect temperatures using a probe and examine data. In this temperature lesson students complete an activity using a graphing calculator.
Curated OER
Exploring Circles
Students explore circles using a graphing calculator. In this circles lesson, students write the equation of a circle with a given center and radius length. Students find the most appropriate model for each combination of data they...
Curated OER
Introduction to Limits
High schoolers practice using graphing calculators and spreadsheets as they explore numeric limits using sequences and functions. They complete a sequencing worksheet, and determine which sequence corresponds to story a story called...
Curated OER
Elements of a Short Story
Young scholars analyze elements of a short story by working together. In this literature lesson, students analyze short stories. They use the TI Navigator Application to write their findings.
Saxon
Plotting Functions
Youngsters use a graphing calculator to assist in creating a function table. They graph the function on a coordinate plane. They explore the relationship between the domain and range in the graph. This four-page worksheet contains two...
Curated OER
Solving Quadratic Equations
Explore methods of solving quadratic equations. Review linear functions through playing a "face off" game. Using a graphing calculator, graph quadratic functions and identify the parabola. Define the number of roots in a linear equation...
Curated OER
Making Connections: Matrices, Graph, Linear Systems
In this set of activities, matrices and equations are explored. They work with matrices using pen and paper as well as graphing calculator. Additionally real-world problems are explored.
Curated OER
Regressive Music
Student use the Ti calculator to graph sinusoidal graphs. In this calculus lesson, students use the CBL to collect and analyze data of sinusoidal graphs. They manipulate their collected data and make predictions.
EngageNY
Analyzing Residuals (Part 1)
Just how far off is the least squares line? Using a graphing calculator, individuals or pairs create residual plots in order to determine how well a best fit line models data. Three examples walk through the calculator procedure of...
NASA
Space Shuttle Ascent: Altitude vs. Time
How long did it take to get to that altitude? Using a Google Earth file, groups explore a space shuttle launch. Using a calculator, groups determine the function that models the altitude/time data from an actual launch. With the model in...
Curated OER
Games for Probability: In-Class and Powerball Simulation
Your soon-to-be statisticians play a game to understand the difference between independent and dependent experiments and probability. They draw colored cubes from a bag and then, by either replacing the cube in the bag, or not, for each...
Curated OER
The Swinging Pendulum
Students observe a pendulum and graph their observation. In this algebra lesson, students use the TI calcualtor to graph the motion the pendulum makes. They analyze the graph and make predictions.
Curated OER
How Big Is The Playground?
Students calculate the standard and metric measurements of a playground. In this measurement lesson, students use GPS coordinates and graphing calculators to determine the dimensions of an area outside of the school in both standard and...
BW Walch
Solving Linear Inequalities in Two Variables
Although graphing a linear inequality on the plane is but a few steps added onto the graphing of a linear equation, for many learners the logical leap is quite intimidating. This approachable PowerPoint presentation breaks graphing...
Curated OER
Connecting Factors and Zeros
In this Algebra II lesson, high schoolers explore the connection between the factored form of a quadratics and the zero of a function. Students use a graphing calculator to verify factoring numerically and graphically.
Texas Instruments
2B or not 2B a Functions
Learners use their graphing calculators to view graphs of equations. They tell if each equations is or is not a function and are shown pre-set graphs on their graphing calculators. They use the Quick Poll feature to indicate if the graph...
Curated OER
Off to College
High schoolers investigate linear, quadratic and exponential equations using the TI calculator. They identify relation and functions using ordered pairs, graph the data, analyze the data, and relate it to real-world situations.
Virginia Department of Education
Solving Linear Equations
Practice solving linear equations by graphing. Scholars learn to solve multi-step linear equations in one variable by graphing both sides of the equation separately. They use graphing calculators to find the intersection of the graphs.
Curated OER
Measuring the Wavelengths of Visible Light
Learners demonstrate use of an Emission tube power supply, a diffraction grating, and a scientific calculator to determine the different wavelengths of light.
Curated OER
Exploring Exponential Growth and Decay Functions
Students differentiate between exponential growth and decay. In this algebra lesson plan, students solve exponential equations using properties of exponents. They use the Ti calculator to graph and analyze their functions.
Curated OER
In Debt or Not In Debt
Students investigate the use of credit cards. In this algebra lesson, students differentiate the interest rate of credit cards and how to stay debt free. They identify pros and cons of credit cards.
Other popular searches
- Graphing Calculators Ti 83
- Graphing on Ti 83 Calculator
- Calculator Ti 83
- Ti 83 Calculator Worksheets


