02 x 02 Worksheets
Absolute Value Equations and Inequalities
Demonstrate the meaning of an absolute inequality using three different methods. Here, scholars explore absolute value inequalities through graphing, number line distance, and compound inequalities. Pupils complete various activities to...
Curated OER
Wave Math
Students identify the different factors affecting the size and shape of ocean waves. In this math lesson, students calculate wave speed and wavelength given a mathematical formula.
EngageNY
Why Do Banks Pay YOU to Provide Their Services?
How does a bank make money? That is the question at the based of a lesson that explores the methods banks use to calculate interest. Groups compare the linear simple interest pattern with the exponential compound interest pattern.
Howard County Schools
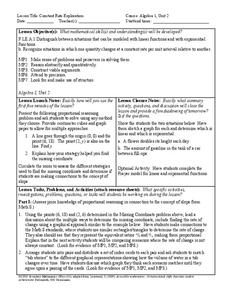
Constant Rate Exploration
Question: What do rectangles and bathtub volume have in common? Answer: Linear equations. Learn how to identify situations that have constant rates by examining two different situations, one proportional and one not proportional.
Curated OER
Book Buffet
Students are encouraged to develop a love for reading by sampling different types of literature. They are encouraged to read one of the books that is sampled. The sample should be challenging for the reader without causing discouragement.
Curated OER
Tempting Temperatures
Students use a thermometer to observe differences in temperature. In this measurement lesson, students use a thermometer to observe the differences in temperature that occur in a refrigerator and a freezer.
Curated OER
Mapping Possible Solutions
Fourth graders propose possible sites for the heart of Florida state capital by mapping collected data onto a Florida state map and recording data in a Travel Log.
Curated OER
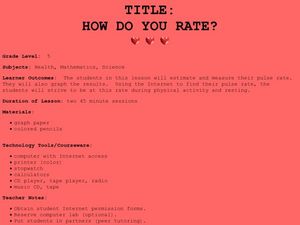
How Do You Rate?
Fifth graders make a graph. In this pulse rate lesson, 5th graders estimate their pulse and record it. Students measure their pulse while at rest and after physical activity and record it. Students use the internet to graph their results...
Curated OER
From Hypothesis to Conclusion...Reading Maps to Understand Proofs
Tenth graders explore the concept of proof. In this proof lesson, 10th graders work in groups to collectively write proofs for directions to places on a map. Students give directions to specific places in big cities such as from the New...
Curated OER
Production and Costs
Students discuss the concept of productivity and participate in an activity in which they test their own productivity in making Origami cups. Teams determine how to improve productivity and then discuss factors that influence...
Curated OER
Chills And Thrills
Students learn what happens when ice melts. They explore melting, and devise ways of speeding up and slowing down the melting process.
Curated OER
Energy and Changes of State
Students complete a variety of labs to help them explain how energy affects the changes in states of matter. They also be required to collect and record data, graph data, and apply interpretations of that data.
Curated OER
MVT for Derivatives
Young scholars find the derivative using the mean value theorem in this calculus lesson. They find the slopes of secant and tangent lines, then analyze the function and identify the slope.
Curated OER
Exponential vs. Power
Pupils differentiate between exponential and power functions. They identify the base, exponent and properties of exponential functions. They also graph the functions using the TI calculator.
Curated OER
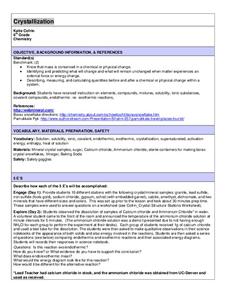
Crystallization
Eighth graders analyze physical change in mass. In this chemistry lesson, 8th graders describe, measure and calculate the amount of physical change occurring in mass before and after the change. Students should be familiar with elements,...
Curated OER
Graph Logarithms
Mathematicians graph logarithmic equations. Teach your students how to identify the intercepts of logarithmic equations and tell whether the function is increasing or decreasing. They find the domain and range of each function.
Curated OER
Fast Food Survey Using Bar Graphs
Second graders create a bar graph to pictorically represent the data collected from a survey of students. They use Excel to electronically create the graphs and data tallies. They then interpret their data using sentences to explain.
Curated OER
What's Your Angle?
Third graders read the story, Magic Schoolbus Inside the Human Body. Then they form right, acute, and obtuse angles using the joints inside their bodies. They write a brief summary about what they learned about angles as a review the...
Micron Technology Foundation
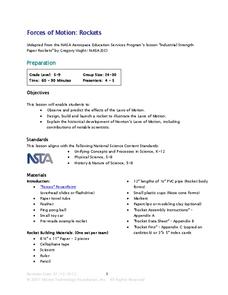
Forces of Motion: Rockets
Young scientists design a rocket to launch using Newton's Laws of Motion in order to discover for themselves the forces of motion.
Curated OER
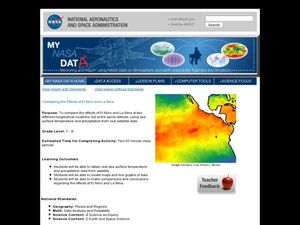
Comparing the Effects of El Nino and La Nina
Students examine the differences between an El Nino and La Nina year. In this investigative lesson plan students create maps and graphs of the data they obtained.
Curated OER
The Effect of Math Anxiety on Cardiovascular Homeostasis
High schoolers examine the effect stress due to test anxiety may have on the heart. As part of the experiment, students hypothesize, collect data, graph data, analyze data and formulate an understanding of their personal level of...
Curated OER
Tree Identification
Students are introduced to the characteristics of trees and different techniques to identify them. They distinguish between a deciduous and a coniferous tree. Students describe at least four characteristics used to identify trees. They...
Curated OER
Prehistoric Native American Lesson Plan: Pictionary with the Past
Learners participate in a vocabulary exercise at a website dedicated to Prehistoric Native Americans.
Curated OER
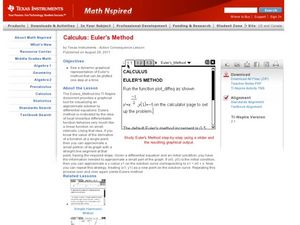
Euler's Method
Learners identify Euler's method of graphing in this calculus lesson. They approximate values of a function and check their work using EM. They also differentiate equations at an exact point.


