Utah Education Network (UEN)
Linear Graphs Using Proportions and Rates
Using a TI-73 or other similar graphing calculator middle school math majors investigate the linear relationship of equivalent proportions. After a brief introduction by the teacher, class members participate in a timed pair share...
Curated OER
Exploring Quadratic Data with Transformation Graphing
Using a data collection device to collect data regarding a bouncing ball, students use various features on graphing calculators to experiment with the parameters of the vertex form of the parabola and their effect on the shape of the...
Curated OER
Functions As Graphs Worksheet
In this math worksheet, learners graph the data given in the organizer. The functions are used to create the new line for finding the possible unknowns.
Curated OER
What's Your Speed?
Learners explore the concept of distance v. time. They use a CBR to collect data on their distance over time, then plot their data using a scatter plot and find an equation to model their data. Pupils discuss what if scenarios which...
Curated OER
Speed, Distance and Time
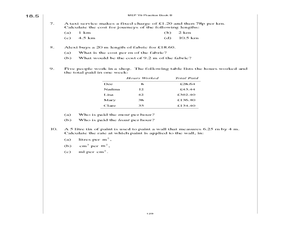
In these calculating speed, distance, and time worksheets, 6th graders review information, formulas, and examples, and solve word problems calculating average speeds, distance traveled, time taken, convert time measurements and speeds,...
Mathematics Assessment Project
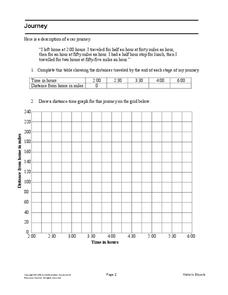
Journey
Drive home math concepts with an engaging task. Learners follow a verbal description to fill in a table and create a distance-time graph representing a car journey. They then answer questions by interpreting the graph.
Inside Mathematics
Squares and Circles
It's all about lines when going around. Pupils graph the relationship between the length of a side of a square and its perimeter. Class members explain the origin in context of the side length and perimeter. They compare the graph to the...
Noyce Foundation
Granny’s Balloon Trip
Take flight with a fun activity focused on graphing data on a coordinate plane. As learners study the data for Granny's hot-air balloon trip, including the time of day and the distance of the balloon from the ground, they practice...
Mathematics Vision Project
Connecting Algebra and Geometry
Connect algebra and geometry on the coordinate plane. The eighth unit in a nine-part integrated course has pupils develop the distance formula from the Pythagorean Theorem. Scholars prove geometric theorems using coordinates including...
Mathematics Assessment Project
Bike Ride
As a middle school assessment task, learners interpret the graph of distance versus time for a bike ride. Pupils then determine distance of the trip, length of the trip, and speeds.
Curated OER
Line Graph: To Grandmother's House We Go
In this line graph worksheet, students use a line graph showing distance traveled to answer a set of 4 related questions. Answers are included on page 2.
Curated OER
Relating Distance and Velocity Over Time
Learners calculate the distance and velocity over time. In this algebra lesson plan, students graph a linear function to represent the distance vers time travel. They interpret their graphs and draw conclusion.
Curated OER
Graph Your Motion
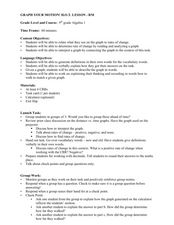
Learners graph their linear equations. In this algebra lesson, students examine their lines and relate it to the slope or rate of change. They relate the steepness of the line to the slope being positive, negative or zero.
Curated OER
The Hudson's Ups and Downs
Even rivers have tides. Older elementary schoolers will discuss the Hudson River and how weather, water craft, and the ocean cause tidal fluctuation. They will examine a series of line graphs that depict tidal fluctuation, then analyze...
Curated OER
Worksheet 1 - Equation of a Line
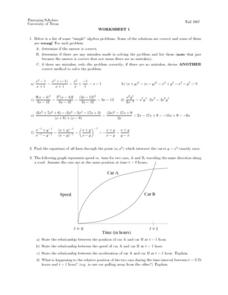
In this equation of a line worksheet, students determine the equation of a line, use the distance formula to identify the relationship between two moving objects, and solve inequalities algebraically. This two-page worksheet contains...
Curated OER
You Are Here
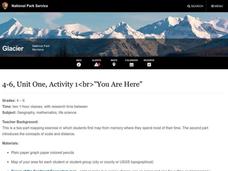
Students map local places and learn to use scale and distance. In this mapping lesson, students map their school and a favorite place. Students recreate their maps showing distance and scale sizes. Students locate their location on a...
Charleston School District
Sketching a Piecewise Function
How do you combine linear and nonlinear functions? You piece them together! The lesson begins by analyzing given linear piecewise functions and then introduces nonlinear parts. Then the process is reversed to create graphs from given...
West Contra Costa Unified School District
Motion Problems
Let's hope class participants don't get motion sickness. In the lesson, class members first solve motion problems using tables and graphs. They then use algebraic techniques to solve motion problems.
Radford University
Midsummer Classic’s Homerun Derby
Hit a home run with your lessons. A two-part activity has learners explore quadratic equations that model the path of a baseball. They see how changing the initial speed of the ball affects its maximum height, maximum horizontal...
101 Questions
Scrambler
Unscramble a carnival mystery! Scholars observe a video of an overhead view of a carnival ride, The Scrambler. They then must determine mathematically where a specific car will stop after a certain amount of time.
Curated OER
Graphing Linear Equations with Two Variables
Can your class solve linear equations in two variables? They will be able to after they engage in this lesson. Individuals graph linear equations in two variables using slope and intercept and identifying the relationship between the x...
Mathalicious
The Fall of Javert
Falling off a bridge might not sound like your idea of a good math problem, but incorporating the final scene of Les Misérables is sure to spark interest. The goal is to use the time Javert fell off the bridge to determine how high he...
Curated OER
CEEnBoT Stories
Students identify the slope of a line as negative, positive, zero or undefined. In this algebra lesson, students identify the distance versus the time using graphs of linear equation. They use the robot and the CEENBoT program to analyze...
Curated OER
Tight Rope
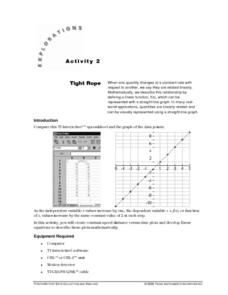
Learn how to explore the concept of linear functions. In this linear functions lesson, high schoolers collect linear data from a motion detector. Students walk to create a linear function. High schoolers plot the points on a graph and...
Other popular searches
- Distance Time Graphs
- Distance Time Graphs Physics
- Distance vs Time Graphs
- Distance and Time Graphs
- Distance vs. Time Graphs
- Distance Time Graphs


