Curated OER
Position vs. Time Graphs of an Object at Rest
The presentation includes nine time vs. position graphs. The first three are meant to be used for teaching how to read them. The next three provide an opportunity for students to practice reading them, while the last three display the...
Physics Classroom
Position-Time Graphs - Conceptual Analysis
Increasingly, colleges and employers want applicants with strong conceptual analysis skills, so give them some practice! Applying these skills to position-time graphs encourages synthesis of knowledge. To complete an installment of a...
Kenan Fellows
Reading Airline Maintenance Graphs
Airline mechanics must be precise, or the consequences could be deadly. Their target ranges alter with changes in temperature and pressure. When preparing an airplane for flight, you must read a maintenance graph. The second lesson of...
Physics Classroom
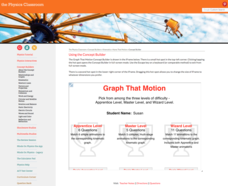
Graph That Motion
Pupils apply their knowledge of the shape and slope of graphs to interpret the motion of an object. Three levels of difficulty provide plenty of practice with support thanks to the "Help Me!" button offered with each question.
Baylor College
Living Things and Their Needs: The Math Link
Enrich your study of living things with these cross-curricular math activities. Following along with the story Tillena Lou's Day in the Sun, learners will practice addition and subtraction, learn how to measure volume and length, work on...
Curated OER
Winter-time Temps
Students measure temperature and become aware the the temperature above and below the snow is different. In this winter temperature instructional activity, students measure temperatures to find variation based on how the snow is packed....
Columbus City Schools
Speed Racers
Who wants to go fast? The answer? Your sixth-grade science superstars! The complete resource offers the ultimate, all-inclusive playbook for mastering the important concepts of speed versus time; distance versus time; and how to graph...
Polar Trec
How Much Data is Enough?
The next time you read a magazine or watch the news, make note of how many graphs you see because they are everywhere! Here, scholars collect, enter, and graph data using computers. The graphs are then analyzed to aid in discussion of...
Curated OER
Making a Line Graph
In this line graph worksheet, students use data given in a table and assign axes, make a scale, plot data and make a line or curve on their constructed graphs.
Curated OER
Graphing Speed
For this graphing worksheet, students read about independent and dependant variables and learn how to determine speed from the slope of a position vs. time graph. This worksheet has 4 matching, 17 fill in the blank, and 2 problems to solve.
Physics Classroom
A Wiggle in Time Lab
Though an alternative method is suggested, the best way to carry out this investigation is with the use of a computer-interfaced motion detector. Physics fanatics hang a mass on the end of a spring and analyze its motion verbally,...
Curated OER
Velocity vs. Time
Twelfth graders read and interpret v-t graphs. After studying velocity and time, 12th graders read graphs to calculate the acceleration of a moving body and determine the distance and displacement of a body. Students explore the...
CPO Science
Physics Skill and Practice Worksheets
Stop wasting energy searching for physics resources, this comprehensive collection of worksheets has you covered. Starting with introductions to the scientific method, dimensional analysis, and graphing data, these skills practice...
Curated OER
Speed
Fifth and sixth graders practice working in pairs to determine whether they can walk with constant speed. They test themselves, collect their data, draw graphs with their data collected, manipulate the data, and then draw conclusions...
Curated OER
Environmental Agents of Mathematics: Mathematics for Change
High schoolers analyze environmental science data using Math. They do research about renewable energy, gather data, create graphs and interpret their findings. Then the group presents their arguments persuasively using their findings to...
Curated OER
Let's Grow Plants!
Students read and dramatize the stories "The Tiny Seed" and "The Carrot Seed" as an introduction to seeds and what they become. They work in small groups to plant their own seeds and over the span of a week (+ or -)students keep track of...
University of Minnesota
Do the Stroop
The Stroop test helps diagnose executive function disorders when used in conjunction with other tests. Reading color words and identifying colors seem like basic skills, but the Stroop test may show otherwise. Scholars work with a...
Curated OER
Position and Time Graphs
A series of graphs are displayed with points plotted for time and position. A question is asked for each, requiring your class to view one axis and track its partner coordinate. A few examples are given to begin each section, and so this...
National Wildlife Federation
Yesterday: Our Energy Needs Over Time
How has our relationship to energy changed over time? An engaging exploration challenges learners to create a timeline showing human energy needs and uses over time. Scholars review what timelines are, choose a 50-year period in history...
Curated OER
Relative Dating-Telling Time Using Fossils
Students explore how to read fossil range charts. They develop an knowledge of the strengths and weaknesses of the fossil record. Students become familiar with the concepts index fossil and fossil range. Students use bar graphs to...
NASA
Discovering the Milky Way
What do you call a tiny collection of galaxies? A puny-verse! Young scholars graph data gathered by scientists studying Cepheids. They attempt to identify a relationship between the variables through standard and logarithmical graphing....
Chicago Botanic Garden
Plant Phenology Data Analysis
Beginning in 1851, Thoreau recorded the dates of the first spring blooms in Concord, and this data is helping scientists analyze climate change! The culminating instructional activity in the series of four has pupils graph and analyze...
Beyond Benign
Municipal Waste Generation
Statistically, waste may become a problem in the future if people do not take action. Using their knowledge of statistics and data representation, pupils take a look at the idea of waste generation. The four-part unit has class members...
Curated OER
It's Time to Make Time!
Learners explore the evolution of time measurement, and explain the relationship of sunrise/sunset to length of daylight. They collect data and calculations to determine length of daylight during a given day.


