Curated OER
Take Me Out To the Ball Game
Learners use a map to graph and locate major league teams of different sports. In groups, they analyze the population data of the United States and compare it with the amount and location of the major league teams. They share their...
Curated OER
Organizing And Reading Data
Learners complete three parts of an "Organizning and Reading Data" worksheet. First, they go over the rubric to determine the work will be scored. They organize data by taking tallies, make a pictograph and a bar graph using the data....
Curated OER
Great Flathead Lake Ecosystem Mystery
Learners analyze data to solve the mystery of what contributed to an ecological disaster at Great Flathead Lake. They read and graph the available data, create a food web of the problem ecosystem, and construct a formal problem statement...
Curated OER
Nutrition Labels
Students read and interpret nutrition fact labels ("food labels") from food products, a task that involves the use of various mathematics skills (e.g., number concepts and number sense).
Curated OER
Successive Approximation and Euler's Method
In this approximation activity, students use the Euler's method to interpret a piecewise linear function. They explore why the approximation produced using a smaller stepsize is a better approximation. This four-page activity contains...
Curated OER
HOW FAST DO SEDIMENT GRAINS OF DIFFERENT SIZES SETTLE?
Students conduct an experiment using sand, a jar, and a paper clip to analyze the effects of different kinds of sand vis a vis its sediment. They graph their findings and analyze for factors of size, shape, and density.
Curated OER
If You're Under Pressure, Blame It On The Air Force
Young scholars complete an experiment in which they demonstrate that air exerts a force. In groups, they create their own siphon and define air pressure. They estimate the time it might take to siphon various amounts of water. They...
Curated OER
Fall is All Around Us
Pupils develop and create a production company and produce a fall event that demonstrates what they have learned in various subject areas. STudents create stories, complete a venn diagram comparing fall and summer, graph and measure...
Curated OER
Outbreak!
Eleventh graders explore the spread of a disease through a population. In this Algebra II lesson, 11th graders analyze graphical data representing they spread of a disease. Students produce a graph of the virus data,...
Curated OER
Systems of Equations
Students solve systems of equations. In this algebra lesson, students use elimination and substitution to solve for the point of intersection. They use graphing to see where the two lines intersect.
Curated OER
Evaluating Data
In this data activity, students learn how to organize the data collected during an experiment and practice finding patterns. Students graph a table of experimental data and complete 1 short answer question.
Curated OER
More Complicated Functions: Introduction to Linear Functions
Young scholars explore the concept of linear functions. In this linear functions lesson plan, students translate linear functions from tables to graphs to equations. Young scholars use an applet to write a function rule for a linear...
Curated OER
Trouble in the Troposphere
Students create graphs using NASA data, compare ozone levels of several U.S. cities, analyze and evaluate the data and predict trends based on the data, and discuss and describe how human activities have modified Earth's air quality.
Curated OER
Porosity and Permeability
Young scholars examine the concepts of porosity and permeability. They conduct experiments to determine the porosity and permeability of gravel, sand, and clay. After performing the experiments they collect and graph data, comparing...
Curated OER
Surface Air Temperature Trends of the Caribbean
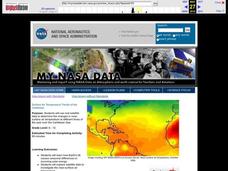
Students investigate the seasonal changes to sea surface and near-surface air temperatures near the equator. They use actual satellite data to track and graph the differences in air and sea temperatures during different seasons in the...
Curated OER
Investigating Median, Mode, and Mean
Students develop strategies to organize data while following teacher demonstration. They calculate the mean, median and mode of a data set while determining the relationships between the numbers. They analyze data from tables and double...
Curated OER
Swinging
Students examine and modify a swinging apparatus. They describe the motion of an object by its position, direction of motion, and speed. Students measure motion using a graph.
Curated OER
The Rare Earth - How Rare Is Earth-Like Life?
Students systematically investigate the time frame for complex life to develop on Earth. They approximate how many other planets there may be harboring Earth-like complex life in our galaxy.
Curated OER
Observing and Predicting Weather from a Weather Station
Fourth graders us a Weather Log data chart to record the date, time, day, and weather. They discuss different instruments and charts needed to record the information. Students turn in their weather logs at the end of two weeks and...
Curated OER
de Soto's Expedition: An Alternate Route
Eighth graders interpret historical evidence presented in primary and secondary resources. In this Exploration Age lesson, 8th graders compare historical maps with new maps focusing on the route of Hernado de Soto.
Curated OER
Do Vampires Really Exist?
Pupils identify and extend a number pattern into very large values. They create and interpret a graph based on their number patterns. Students compare a math model with real-world statistics about the existence of vampires.
Curated OER
The Anti-Gravity Machine
Learners examine physics by completing a bicycle experiment in class. In this gravity instructional activity, students measure the characteristics of different bicycles and compare their different race times. Learners utilize a...
Curated OER
What is a Box and Whisker Plot?
Eighth graders explore the correct use of box and whisker plors. The times when they are appropriate to use to compare data is covered. They plot data according to statistical analysis including mean, median, and mode.
Curated OER
Atlatl Lessons Grades 4-12: Lesson for Beginning Users of Atlatl
Sixth graders determine the mean, range median and mode of a set of numbers and display them. In this data instructional activity students form a set of data and use computer spreadsheet to display the information. They extend of...


