EngageNY
Relationships Between Quantities and Reasoning with Equations and Their Graphs
Graphing all kinds of situations in one and two variables is the focus of this detailed unit of daily lessons, teaching notes, and assessments. Learners start with piece-wise functions and work their way through setting up and solving...
Columbus City Schools
Speed Racers
Who wants to go fast? The answer? Your sixth-grade science superstars! The complete resource offers the ultimate, all-inclusive playbook for mastering the important concepts of speed versus time; distance versus time; and how...
Curated OER
Drive the Data Derby
Three days of race car design and driving through the classroom while guessing probability could be a third graders dream. Learn to record car speed, distances traveled, and statistics by using calculation ranges using the mean, median,...
Columbus City Schools
To Measure its Mass or Volume?
Atoms, elements, and molecules, oh my! Teaching the fundamentals of chemistry to curious sixth graders has never been easier to accomplish. Here is a resource that pulls together everything needed to get them off to a good start,...
Beyond Benign
Municipal Waste Generation
Statistically, waste may become a problem in the future if people do not take action. Using their knowledge of statistics and data representation, pupils take a look at the idea of waste generation. The four-part unit has class members...
Intel
What Does This Graph Tell You?
What can math say about natural phenomena? The fifth STEM lesson in this project-based learning series asks collaborative groups to choose a phenomenon of interest and design an experiment to simulate the phenomenon. After collecting...
The New York Times
The Careful Reader: Teaching Critical Reading Skills with the New York Times
The 11 lessons in this educators' guide focus on using newspapers to develop critical reading skills in the content areas.
Mathematics Vision Project
Module 2: Systems of Equations and Inequalities
The brother-sister pair Carlos and Clarita need your class's help in developing their new pet sitting business. Through a variety of scenarios and concerns presented to the siblings, the learners thoroughly explore systems of equations...
Radford University
Sleep and Teen Obesity: Is there a Correlation?
Does the number of calories you eat affect the total time you sleep? Young mathematicians tackle this question by collecting their own data and making comparisons between others in the class through building scatter plots and regression...
Curated OER
Button Bonanza
Collections of data represented in stem and leaf plots are organized by young statisticians as they embark some math engaging activities.
Mathematics Vision Project
Module 1: Sequences
Take steps into sequences. An 11-lesson unit builds upon pupils' previous understanding of writing expressions to develop the idea of sequences. The resource explores both arithmetic and geometric sequences using recursive and explicit...
Florida Department of Health
Mental and Emotional Health Education Unit
Stressed out? To begin a mental and emotional health unit, participants take a stress test to determine their level of stress. They study the effects of stress, identify sources of stress in their lives, and learn different ways to...
Curated OER
Flicking Football Fun
Young mathematicians fold and flick their way to a deeper understanding of statistics with a fun, hands-on math unit. Over the course of four lessons, students use paper footballs to generate data as they learn how to create line...
Intel
Choreographing Math
Leaners investigate families of linear functions through dance. They choreograph dance moves to model nine unique linear functions of their choosing. Using their dance moves, teams create a video presentation complete with music and...
Tech Museum of Innovation
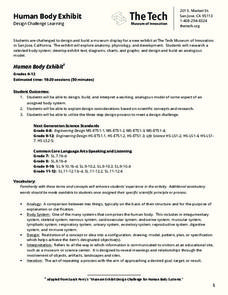
Human Body Exhibit
Explore human anatomy and physiology using models. Scholars study systems of the human body and design a display for a museum exhibit. To complete the activity, individuals create analogous models of their chosen human body systems.
Tech Museum of Innovation
Analogous Models
What goes into a museum display? A secondary-level STEM project prompts groups to design a museum display for the Tech Museum of Innovation. They create an analogous, interactive model illustrating a science concept to complete the...
Curated OER
Second Graders Create Their Own Social Studies Book (Part I, The 5Ws of the Constitution)
Students develop their own social studies textbook using a blank theme book as they complete activities and learning experiences throughout the year. The activities are in art, music, simulations, read alouds, shared writing and a class...
Texas Education Agency
Texas Gateway: Ap Physics: 2.3 Time, Velocity, and Speed
By the end of this section, you will be able to do the following: Explain the relationships between instantaneous velocity, average velocity, instantaneous speed, average speed, displacement, and time; Calculate velocity and speed given...
CK-12 Foundation
Ck 12: Instantaneous Velocity
[Free Registration/Login may be required to access all resource tools.] Students explore instantaneous velocity and how to calculate it. They also learn how interpret and create position vs time graphs.
PBS
Pbs: The Lowdown: What You Need to Know About Immigration Reform
Interpret graphs showing changes over time in the percentage of foreign-born US residents and in annual deportations in this interactive from KQED. In the accompanying classroom activity, students use the interactive and look at how...
PBS
Pbs: The Lowdown: Poverty Trends: What Does It Mean to Be Poor in America?
Use math to learn about changes in US wealth distribution and poverty rate over time in this interactive from KQED. In the accompanying classroom activity, students interpret the graphs and consider how the poverty rate spike following...


