Curated OER
Photoshop for Fifth Graders: The First Step is Word
Fifth graders create an image in Microsoft Word. In this technology lesson, 5th graders take an image and practice backgrounds, borders, rotation and more. They start with Microsoft Word before trying the Photoshop program.
Curated OER
Would You Live Common Law?
Young scholars explore common law. In this sociology lesson, students discover what constitutes common law unions in Canada and then discuss how common law relationships compare to marriages.
Curated OER
Flowchart
Students view examples of different flow charts and then create one on their own. In this flowchart lesson plan, students create a flow chart for washing the dog.
Curated OER
Exploring Quadratic Graphs
Students solve quadratic equations using graphs. In this algebra lesson plan, students factor quadratic equations and graph their answer. They discuss the shape of their graph based on the function.
Curated OER
Exploring the Hudson in 1609
In this geography worksheet, 5th graders study about the exploration of the Hudson River. Students respond to 7 multiple choice questions about the presented facts.
Curated OER
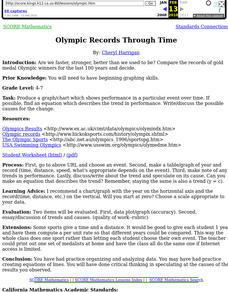
Olympic records through time
Young scholars compare the records of gold medal Olympic winners for the last 100 years and decide if we are faster, stronger than in the past.
Curated OER
"Career Day"
Students gain specific knowledge of careers that might interest them and use this information in their college search and application process. They contact alumni to inquire about internships or shadow opportunities.
Curated OER
Explain the Change
Twelfth graders complete research relating to population changes in counties/states in the U.S. from 1900 to 2000 and use the slope formula to determine the overall change in population for each of the ten decades. They present their...
Curated OER
Graphing
Seventh graders identify the different graphs used in science. For this graphing lesson, 7th graders analyze the three kinds of graphs. They construct a graph that best describes a given data.
Curated OER
Aeronautics Propulsion
Students use the World Wide Web to access additional information needed to complete the activities on the forces on an airplane, the function of the stabilizer, and the calculation of Mach speed, temperature, pressure, and thrust.
Curated OER
One China for All?
Students explore relations among Taiwan, China and the United States in the 20th century.
Curated OER
The Origins of Islamic Law: Sharia, Islam, Muslims
Students examine the development and history of Islamic Law (Sharia). They also begin to make comparisons to Western and Judaic Law traditions.
Curated OER
Immigration and Settlement of Ethnic Groups in the Pacific Northwest
Students examine ethnic history of the Pacific Northwest in the period 1850-1950. They research documents and images in digital archives to explore immigration of various ethnic groups that settled in the region during this period.
Curated OER
Math & Social Science
Learners are given data and are to calculate averages and yearly totals of how many cars travel the Tacoma Narrows Bridge. They also make a graph of the data.
Curated OER
Ethnic Culture and Identity in the Columbia River Basin, 1850-1950
Students explore cultural history of immigrant groups that settled in the Columbia River Basin from 1850 to World War II, and examine various primary sources to explore role cultural and social customs played in keeping alive immigrant...
Curated OER
African Americans in the Columbia River Basin
Young scholars research the Columbia River Basin Ethnic History Archive (CRBEHA) and use a variety of primary sources to explore the history of blacks in the region.
Curated OER
Social Studies: Migration and Immigration to the Columbia River Basin
Students examine the history of immigration in the Pacific Northwest. They make oral and written presentation about the historic effects of immigration in the Northwest.
Curated OER
Mexican-Americans: Yesterday, Today and Tomorrow
Learners examine how the Mexican-American culture developed in Los Angeles. They explore the past, present and future of Mexican-Americans in LA and present their findings in a PowerPoint presentation.
Curated OER
Breadline
Students examine the breadlines during the Great Depression. They view a short video about different country's responses to mass unemployment. They interview family members if possible who lived during the Depression.
Curated OER
Current Weather Condition Site Selection
Students work together to agree on the days "preferred weather conditions." They choose a city in the world they think will have the preferred current weather conditions.
Curated OER
Graphing Inertia: An Oxymoron?
Eighth graders investigate Newton's Law of Inertia in order to create a context for the review of the use of different types of graphs. They practice gathering the data from an experiment and put it into the correct corresponding graph.
Curated OER
The effect of hunger on children and graphing
Students research the effects of hunger on society. In this Current Events lesson, students create a graph to present their findings.
Curated OER
Working with Frequency Tables
For this Working with Frequency Tables worksheet, learners analyze data that is organized in simple frequency charts. They calculate average from data presented in a frequency table, calculate a cumulative score, and identify data that...
Curated OER
Breaking News English: Bullying an Epidemic in the U.K.
In this English worksheet, students read "Bullying an Epidemic in the U.K.," and then respond to 47 fill in the blank, 7 short answer, 20 matching, and 8 true or false questions about the selection.


