Curated OER
Making a Report to President Washington
Students gain an understanding of some of the challenges the U.S. faced at its birth. They are asked to compose a report on the state of the nation in 1790 (addressed to President George Washington), which includes a narrative, maps and...
Curated OER
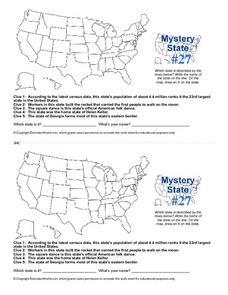
Mystery State #27
In this mystery state worksheet, learners answer five clues to identify the state in question. They then locate that state on a map.
Curated OER
Little House in the Census: Almanzo and Laura Ingalls Wilder
Students view copies of the 1880 and 1900 censuses and then create and conduct their own census of their homes, comparing all three.
Gobal Oneness Project
A Tapestry of Multicultural Diversity
New York City is a perfect place to begin a study of multicultural diversity. The largest and the most culturally diverse city in the United States provides the backdrop for a photo essay that features images of cultural and religious...
DocsTeach
Exploring America's Diversity: Miguel Miñan (Beginner)
Many have traveled from around the globe searching for the American dream. Scholars research the life Miguel Miñan, an immigrant from Brazil, using ship and census records. The activity focuses on American diversity and highlights the...
CK-12 Foundation
Interpretation of Circle Graphs: Northwest Region Population Pie
Given populations of the five Northwestern states, learners create a circle graph. Using the data and the pie chart, they make comparisons between the populations of the states. Finally, the pupils determine how the chart will change...
National Endowment for the Humanities
African-American Communities in the North Before the Civil War
Middle schoolers may be surprised to learn that before the American Civil War there were more slaves living in New York than there were in Kentucky! Young historians examine maps and census data to gather statistics about...
Curated OER
The Brief American Pageant: The American People Face a New Century
The political landscape of Y2K is the focus of this series of slides, which cover the later years of the 20th century. Charts detail the poverty and social welfare rates in the 20th century, as well as a pie graph displaying the sources...
Curated OER
U.S. Population Hits 300 Million
Students read a story about the population in the United States reaching 300 million, and answer vocabulary and comprehension questions about it. For this population lesson plan, student respond to literature by answering questions,...
Federal Reserve Bank
Barbie in the Labor Force
How have the women's share of the labor force and chosen occupations evolved in the United States over the last century? Using census reports, graphs detailing the gender makeup of the labor force, and analysis of the careers of Barbie...
Curated OER
Population Pyramids
Young scholars work with and make population pyramids. In this population pyramid lesson, students use census data to make population pyramids for China, India, and the United States. They use the information to determine why jobs are...
Curated OER
Create Your Own Form
Students gather and organize data using a mock census form, and determine mean, mode, range, and median for sets of data.
Curated OER
The Immigrant Experience
Students utilize oral histories to discover, analyze, and interpret immigration and migration in the history of the United States. A goal of the unit is fostering a discussion and encouraging students to make meaning of the bigger...
Curated OER
Regional Economics in the United States
Learners describe and provide examples of the primary factors
behind the regional pattern of economic activity in the United States. They create maps showing regional economics patterns
in the US and examine those patterns in comparison...
Curated OER
Historical Population Changes in the US
Students conduct research on historical population changes in the U.S. They conduct Internet research on the Historical Census Data Browser, create a bar graph and data table using a spreadsheet program, and display and interpret their...
Curated OER
Immigration in Spain
How many people immigrate to Spain illegally each year? Both the United States and Spain see a lot of illegal immigration. Advanced learners will read various articles, compare and contrast the situation in both countries, and discuss...
Curated OER
Focus on Economic Data: US Employment and the Unemployment Rate, March, 2012
Read all about the various types of unemployment and the United States is are currently at the low-point of an unemployment cycle. Kids examine what economic factors affect the unemployment rate, and what data shows for different US...
National Endowment for the Humanities
People and Places in the North and South
North and South: two opposite directions and two opposite economic and social systems in time of the Civil War. Pupils peruse census websites and primary source photographs to understand what life was like for the everyday person before...
Curated OER
Slavery by the Numbers
Students examine the role of slavery in the United States. In this American history instructional activity, students watch segments of the video "Slavery and the Making of America." Students conduct further research pertaining to Thomas...
Curated OER
Then and Now
Students conduct research and use census data to compare different times and places. In this census lesson, students interpret data from charts and graphs, comparing census information from two time periods as well as from two different...
Curated OER
Mapping Our Home
Students explore how communities participate in census counting. In this census activity, students recognize the absolute and relative location of a state and understand ideas about civic life and government.
Curated OER
It's About Us
Young scholars understand ideas about civic life and government. In this census lesson, students participate in a First We Count Reader's Theater and answer reading questions about the script in order to gain a better understanding of...
Curated OER
Lesson 2: Mapping Our Home
Young scholars recognize the importance of community participation in the census. In this U. S. Census lesson plan, students use map-reading skills to find answers and learn the difference between senators and members of Congress.
Curated OER
A Nation Counts
Students explore the functions of the U.S. Census. In this civics lesson plan, students understand the origins of the census and its role in U.S. history, recognize the political importance of apportionment based purely on population,...


