Hi, what do you want to do?
Texas Instruments
Math TODAY for TI-Navigator System - Is Leisure Time Really Shrinking?
High schoolers organize data from the USA TODAY Snapshot, "Is leisure time really shrinking?" into two scatter plots and determine the quadratic model for each scatter plot. They determine if these graphs intersect and learn the concept...
Curated OER
Math Today - World Population Milestones
Students use the data from USA TODAY Snapshot "World population milestones" to explore and explain the trends in the world population.
Curated OER
Word Problems: "Leaving D.C."
In this solving math story problems worksheet, students read statistics from the Student edition of USA Today to solve word problems. Students solve 6 problems.
Curated OER
Religious Book Sales Climb
In this analyzing data activity, students review a graph from the USA Today. Students study the graph and answer four questions about the graph. There are also two extension questions included.
Curated OER
Economics: Supply, Demand & Personal Finance
For this Economics/Personal financial literacy worksheet, students use USA Today to find article, photos, charts, or graphics related to events that are affecting the prices of different products and services. Students answer...
Curated OER
Critical Thinking & Writing: Brainstorming
Have your young writers organize their thoughts before writing. They generate ideas through various brainstorming activities prior to writing a mock feature news story for USA Today. A series of USA Today articles debating the level of...
Curated OER
Math TODAY - The New Color of Money
Students work with large numbers when determining the height of a stack of $20 bills.
Curated OER
Sky High Fuel
In this fuel price worksheet, students examine a chart that shows fuel prices between 2001 and 2005. They compute the answers to 3 word problems in which they work with finding average. They complete an extension activity in which they...
Curated OER
Number of Cell phones in Use Per Household
In this cell phones learning exercise, students study a bar graph of the number of cell phones usage in households. Students answer 5 questions about the graph.
Curated OER
Corn-Crop is a Bin-Buster
Learners calculate percent change and create lists of data. They enter the corresponding bushels of corn measured in billions to their list and display, then convert the acres into scientific notation and use the value on the home screen...
Curated OER
Drug Sales Soar - Rate of Change
In this prescription drug instructional activity, learners answer short answer questions and create graphs on the sales of prescription drugs over a five year span. Students complete six questions.
Curated OER
Drug Sales Soar: Bar Graph
In this graphs instructional activity, students analyze a bar graph that shows retail prescription drug sales in the U.S. Students complete five problem solving questions about the data on the graph.
Curated OER
Dangerous Fun
In this line graph worksheet, students analyze the data on a graph about toy-related injuries by year. Students solve 5 problems in which the change in injuries per year is calculated and recorded on a table.
Curated OER
More Students Taking Online Courses
In this graph worksheet, students study a bar graph that shows the number of college students taking at least one online course. Students answer 4 problem solving questions about the data on the graph.
Curated OER
U.S. Beach Attendance
In this bar graphs worksheet, students analyze the information about beach attendance over a period of 5 years. Students solve 3 story problems about the graph.
Curated OER
Seized Before Flights: Graph
In this bar graph worksheet, students analyze a graph that show the number of prohibited items intercepted at U.S. airport screening checkpoints. Students answer 3 problem solving questions about the data on the graph.
Curated OER
Live, From New York
In this data analysis worksheet, students study the information on a data table about the hosts of Saturday Night Live. Students answer 8 problem solving questions about the table.
Curated OER
More of U.S.
Explore graphical representation of a real-life data set and determine the exponential regression model for the data in your classroom. Students also compare the estimated value to the given value by determining the percent error.
Curated OER
Meatiest States: Graph Problem Solving
For this graph problem solving worksheet, students analyze a graph that shows commercial red meat production in five states. Students answer 5 word problems using the data on the graph.
Texas Instruments
Texas Instruments: Science Today Breast Cancer Risks
The USA TODAY Snapshot? "Breast cancer risks" shows the percentage of women in several age categories that, statistically, develop breast cancer. Students will notice that the percentages increase as women get older. In this activity,...
Texas Instruments
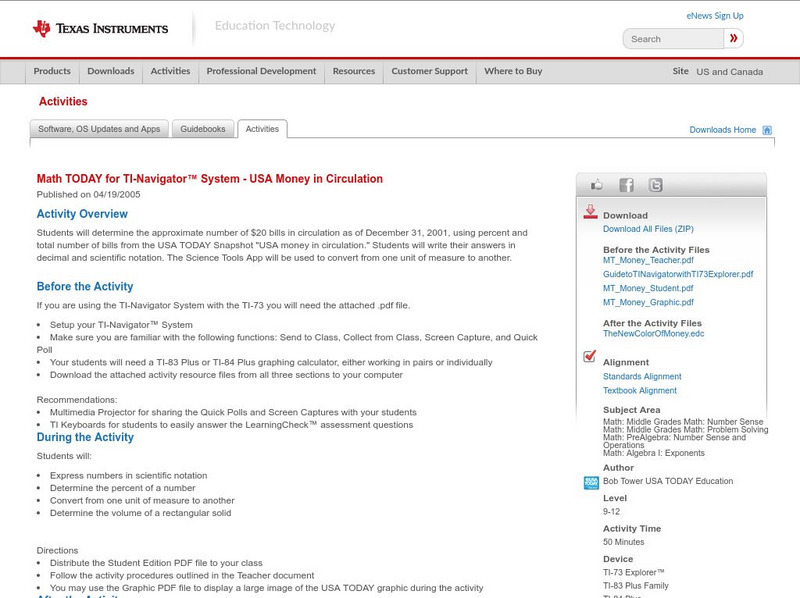
Texas Instruments: Math Today for Ti Navigator Usa Money in Circulation
Students will determine the approximate number of $20 bills in circulation as of December 31, 2001, using percent and total number of bills from the USA TODAY Snapshot "USA money in circulation." Students will write their answers in...
Texas Instruments
Texas Instruments: Science Today 2004 Corn Crop Is a Bin Buster
With this resource, students will examine and evaluate data on the corn harvest in the United States over the past several years. Using the USA TODAY Snapshot "2004 corn crop is a bin-buster," data from the USDA Statistics Service...
Texas Instruments
Texas Instruments: Math Today: Red Meat Consumption Continues to Drop
The USA TODAY Snapshot, "Red meat consumption continues to drop," will allow students to work with two sets of data over the same time period. This activity will show how a system of equations can be used to answer questions about the...
Texas Instruments
Texas Instruments: Science Today West Nile Killing More People
After studying the USA TODAY Snapshot? "West Nile killing more people,"students will compare the number of West Nile cases in the United States over the past three years. From the data, percent increases and decreases from year to year...


