EngageNY
Discovering the Topic: Inferring and Confirming Using Evidence
Allow your class to figure out what they will be studying through an inquiry-based anticipatory set that involves analysis of mystery documents and practice with making inferences. The lesson plan document includes a detailed description...
Benjamin Franklin High School
Saxon Math: Algebra 2 (Section 4)
This fourth of twelve units in a series continues the investigation of functions through equations and inequalities. However, the modular nature of the lessons in the section make this an excellent resource for any curriculum...
CK-12 Foundation
Flashlight
In a simple circuit, does electricity start instantly? A simulation encourages thinking about the flow of electrons at a microscopic level. Pupils control the voltage, resistance, and switch in order to observe the change in both ideal...
PBS
The Lowdown — Examining California's Prison System: Real-World Ratio
Free yourself from the shackles of traditional math lessons. Young mathematicians investigate race, gender, and age differences in California's prison system. They use provided graphics to compare the prison population with the state's...
US Department of Commerce
Educational Attainment and Marriage Age - Testing a Correlation Coefficient's Significance
Do women with college degrees get married later? Using a provided scatter plot of the percentage of women who earn bachelor's degrees and the median age at which women first get married over time, pupils conduct a linear regression...
Curated OER
Graphing With RXTE
Students use data from the Rossi X-ray Tiiming Explorer (RXTE) satellite to analyze and graph.
Curated OER
The Blizzard of 1993
Students read and interpret the information from a barograph from a major winter storm. This task assesses students' abilities to interpret and analyze graphs, construct data tables and graphs, generalize, infer, apply knowledge of...
Curated OER
How High Are the Clouds?
Students analyze height and collect data to create a graph. In this statistics instructional activity, students use central tendencies to analyze their data and make predictions. They apply concept of statistics to other areas of...
Curated OER
Graphing Linear Equations on the TI
Students graph linear equations on the TI calculator. In this algebra lesson, students rewrite equations in the slope intercept form and use the calculator to graph their problem. They work together to interpret the graphs off of the TI.
Curated OER
Quadratic Applications
For this quadratic applications worksheet, high schoolers complete graphs, charts, comparison charts, and more having to do with quadratic equations. Students complete 5 different activities.
Curated OER
Lahar Travel Time
Ninth graders analyze published geologic hazard maps of California and comprehend how to use the map's information to identify evidence of geologic events of the past and present and predict geologic changes in the future. They select...
Curated OER
North vs. South
Students use information about the Union and Confederate troops to create a bar graph. In this graphing lesson, students graph troop information on a bar graph, color coding the information. Students then find the differences...
Curated OER
Data From Interviews
Learners create and conduct a survey about favorite foods, gather and represent the data, interpret data and make predictions to present to the class. They create and use interview questions to gather data. Pupils are explained that...
Curated OER
The Lake Effect
Fourth graders conduct an experiment demonstrating the effects of water and air temperature on precipitation. They create graphs demonstrating their findings using Claris Works for Kids.
Curated OER
My Test Book: Stem and Leaf Plots
In this math skills learning exercise, students solve 10 multiple choice math problems which require they interpret a stem and leaf plot. Students may view the correct answers.
Curated OER
What's Your Line?
Fifth graders collect temperature readings over a period of time, enter the information into a spreadsheet and choose the appropriate graph to display the results.
Curated OER
Technology Literacy Challenge Grant Learning Unit
First graders explore counting and classification. They sort leaves, create graphs, write sentences for the data in the graphs, develop graphs for shapes, favorite animals, birthdays, and participate in a die prediction game.
Curated OER
Walking on Air
Young scholars collect and analyze data with a graph. In this statistics lesson plan, students use central tendencies to find the meaning of their data. They display the data on a Ti calculator.
Curated OER
Skittles, Taste the Rainbow
Fifth graders learn and then demonstrate their knowledge of a bar and a circle graph using the classroom data. Students are given a pack of skittles candy. Students create a bar and circle graph indicating the results of the contents of...
Curated OER
Christmas Presents
Seventh graders create a graph of their Christmas gifts. They develop categories, compute fractional and decimal parts for each category, identify the number of degrees to represent each fractional part, and create a circle graph to...
Curated OER
Let's Go Slopey
Students create a table of values to graph a line. In this algebra lesson, students identify the slope and intercept of a linear equation. They use a Ticalculator to graph their function.
Curated OER
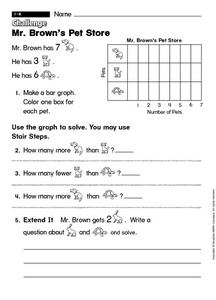
Mr. Brown's Pet Store
In this early childhood problem solving worksheet, students make a bar graph with the provided information and then use the graph to solve 4 problems.
Curated OER
French Fry Run
Student explore estimation and measurement. In this measurement lesson, 2nd graders measure french fries, graph their data, and determine the size of french fries that is the best value. Students practice how to add prices and calculate ...


