Curated OER
The Perfect Principal
Students demonstrate their understanding of math skills. In this data analysis lesson, students complete a worksheet requiring them to calculate mean, median, and mode, and create and interpret graphs. Lesson is intended as an assessment...
Curated OER
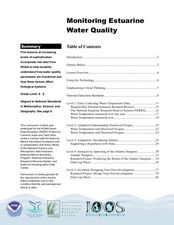
Monitoring Estuarine Water Quality
Students analyze water quality data from real data. In this environmental science instructional activity, students examine how salinity and dissolved oxygen affect the living organisms in the estuary. They interpret graphs to support or...
Curated OER
Harmonic Motion
In this harmonic motion worksheet, students read about the difference between harmonic motion and linear motion. They are given the parts of harmonic motion, graphs of harmonic motion and equations to find the period and frequency of...
Curated OER
Linear Motion 3
In this linear motion worksheet, students answer 11 questions including finding acceleration of moving objects, finding the distance objects travel and finding the time it takes objects to move a particular distance. Students interpret...
Curated OER
Graphs - On the Floor and Ask a Friend
Students create a floor graph and then interview their classmates to create their own graph.
Curated OER
Quiz: Graphs of Polynomial Equations of Higher Degree
In this polynomial equation activity, students find the roots of polynomial functions. They interpret graphs and estimate the solution to given equations. This two-page activity contains ten polynomial equation problems.
Curated OER
Linear and Exponential Functions
This comprehensive unit on linear and exponential functions provides numerous clearly-written worksheets. Topics include graphing linear equations, solving systems of equations algebraically and by graphing, identifying the domain and...
Curated OER
7th Science Quiz
This seventh grade life science quiz has a professional appearance and well-written multiple-choice questions. However, it seems to cover too broad a variety of biology topics for only 15 questions to fully assess. There is one question...
Curated OER
WebQuest: Thrills and Spills- Pick Your Park!
Pupils participate in a WebQuest in which they must determine which amusement park is the "median priced" park. Students visit park websites to accumulate prices for parking, activities, restaurants, and gift shops.
Illustrative Mathematics
Tides
A very simple example of a functional relationship between depth of water and time is shown here. In fact, it might be more useful to use a coastal tide book to better illustrate this real-world experience. Pupils are to count the number...
Eastconn
Learning to Analyze Political Cartoons with Lincoln as a Case Study
Discover the five main elements political cartoonists use—symbolism, captioning and labels, analogy, irony, and exaggeration—to convey their point of view.
Pennington Publishing
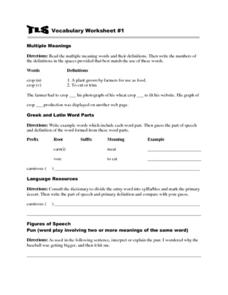
Vocabulary Worksheet #1 & #2
These two worksheets cover several grammatical topics. Pupils work on words with multiple meanings, Greek and Latin word parts, word connotations, academic language, and more. The result is seven quick exercises that could be used...
Tech Know Teaching
5th Grade Constructed Response Question
New to constructed response question worksheets? Here's a model that demonstrates how to construct questions that require readers to interpret graphics found in informational text.
Curated OER
Statistics: Reading and interpreting production graphs
Students interpret and create different types of graphs. They analyze data from charts, develop a survey and design appropriate graphic illustrations and make a presentation.
Curated OER
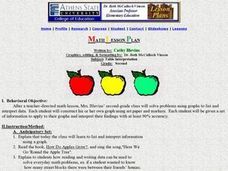
Table Interpretation
Students solve problems using graphs to list and interpret data. Each student construct his or her own graph using art paper and markers. They be given a set of information to apply to their graphs and interpret their findings.
Alabama Learning Exchange
Graphing Stations
Students explore the concept of graphing stations. In this graphing stations lesson, students head to various teacher set-up stations involving slope, point-slope, standard form, parallel lines, etc. Students work problems at...
Curated OER
Graphs Galore
Fourth graders conduct surveys to collect data. They analyze and interpret the data, then determine which type of graph is appropriate for the data. Students use the data to make predictions, discover patterns and draw conclusions...
Curated OER
Creating Line Graphs
Pupils draw line graphs. In this math lesson, students interpret minimum wage data and graph the data in a line graph. Pupils predict the next minimum wage and figure the earnings for a 40 hour work week for someone earning the minimum...
Curated OER
Using Non-Text Features
Second graders examine graphs and charts from their local newspaper. As a class, they discuss what the data means and how it relates to the article. In groups, they are shown two sets of graphs or charts and they practice explaining...
Curated OER
C is for Cookie-A MEAN-ingful Graphing Activity
Third graders, in groups, dissect a variety of brands of chocolate chip cookies and calculate the mean for each brand. They create their own bar graphs, pictographs, and line graphs to represent information.
Curated OER
Graphing Population Around the World
Students define specific vocabulary necessary for understanding population data. They collect, analyze, and interpret specific data. They utilize computer programs in order to create graphs of collected data.
Curated OER
Relating Graphs to Events
In this algebra worksheet, students identify the graph that goes with-the equation. They solve word problems using graphs. There are 4 problems with an answer key.
Curated OER
Graphing Real World Situations
Students solve linear equations using graphs. In this algebra lesson, students depict real life situation using lines and functions. They identify the slope, data and predict graphing behavior.
Curated OER
Graphing Data from the Chemistry Laboratory
Young scholars graph and analyze data using a spreadsheet.


