Curated OER
Growing and Graphing
Students visit a 2nd and a 4th grade class to measure the heights of older students using large building blocks as a non-standard unit of measure. They can also measure adults in the school community. Results are displayed in...
Alabama Learning Exchange
We Love to Graph!
Students experience graphing points. For this graphing points lesson, students play an on-line game where they must name 10 coordinate pairs correctly. Students play a maze game where they maneuver a robot using coordinate...
Curated OER
Using Inequalities to Problem Solve
Students explore inequalities. In this Algebra I lesson, students solve and graph linear inequalities involving addition, subtraction, multiplication, or division. Students use inequalities to solve and graph real-world problems.
Curated OER
Interpreting Oceans of Data
Sixth graders analyze the data from a scientific experiment. In this statistics lesson, 6th graders answer questions about some data to show their understanding of the data. They apply the result to future decisions when using data.
Curated OER
Generating Points and Graphing
Students create a table of values to help them plot. For this algebra lesson, students plot their points on a coordinate plane creating a graph. They observe and analyze linear functions.
Curated OER
Linear Equations and Their Graphs
In this Algebra I/Algebra II worksheet, students solve problems involving interpreting the slope of a linear equation as a rate of change. The two page worksheet contains a combination of seven multiple choice and free response...
Curated OER
INTERPRETING MAGNETIC FIELD MAPS
High schoolers interpret magnetic field maps, rotate the coordinates to obtain different views, change the coordinate representation, and produce alternate graphical representations.
Curated OER
United States Population: Using Quadratic Models
In this United States population worksheet, learners solve word problems about the United States population by using the quadratic formula. Students complete 6 problems.
Curated OER
Using Radiosonde Data From a Weather Balloon Launch
Student use radiosonde data from a weather balloon launch to distinguish the characteristics of the lower atmosphere. They learn the layers of the atmosphere. They graph real atmospheric data.
Curated OER
Problem Solving 1
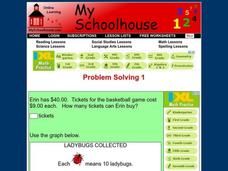
For this online interactive problem solving worksheet, students read a graph and use their problem solving skills in order to respond to 10 questions.
Curated OER
Computer Graphing
Students research the Internet or create surveys to find graphable data. They collect, organize, analyze and interpret the data. Finally, they choose the appropriate type of graph to display the data and find the measures of central...
Curated OER
Problem Solving 1
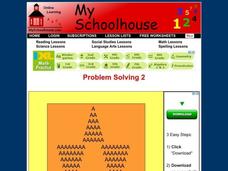
In this online interactive problem solving worksheet, students examine a diagram and use their problem solving skills in order to respond to 5 questions.
Curated OER
Using a Thermometer
First graders use their senses to formulate questions and make predictions to determine what is in the "Wonder Bag". They hold pieces of ice and examine while listing descriptors on a chart and then take their own temperature using an...
Curated OER
Finding Area Using Geometry, Integrals, and Riemann Sums
In this area worksheet, learners calculate area in five problems using geometry and integrals and find patterns using Riemann sums in one problem.
Curated OER
High School Mathematics Problems from Alaska: Reading a Graph: Azimuth Range vs. Day in Barrow, Alaska
Students focus on reading and interpreting information from a graph.
Curated OER
Graphing Favorite Colors
Third graders collect data and insert it into ClarisWorks to create a spreadsheet/graph of their favorite color. They interpret the data together.
Curated OER
3-D Beginning Graphs
Students explore the concept of big and small. They collect objects from the classroom, sort them by size, and create a graph using Duplo stacking blocks.
Inside Mathematics
Printing Tickets
Determine the better deal. Pupils write the equation for the cost of printing tickets from different printers. They compare the costs graphically and algebraicaly to determine which printer has the best deal based upon the quantity of...
Curated OER
Temperature and the Earth's Atmosphere
Earth science super stars visit the National Earth Science Teachers Association's interactive website to glean information on the layers of the atmosphere. Data tables are provided for them to record what is collected. This assignment...
Inside Mathematics
Functions
A function is like a machine that has an input and an output. Challenge scholars to look at the eight given points and determine the two functions that would fit four of the points each — one is linear and the other non-linear. The...
Curated OER
Button Bonanza
Collections of data represented in stem and leaf plots are organized by young statisticians as they embark some math engaging activities.
EngageNY
Increasing and Decreasing Functions 2
Explore linear and nonlinear models to help your class build their function skills. In a continuation of the previous lesson, learners continue to analyze and sketch functions that model real-world situations. They progress from linear...
National Council of Teachers of Mathematics
National Debt and Wars
Take a functional approach to the national debt. Learners collect information about the national debt by decade and plot the data. They determine whether an exponential curve is a good fit for the data by comparing the percent changes...
Curriculum Corner
8th Grade Math Common Core Checklist
Ensure your eighth graders get the most out of their math education with this series of Common Core checklists. Rewriting each standard as an "I can" statement, this resource helps teachers keep a record of when each standard was...
