Curated OER
Jim, Tony, and Frank - The School Fundraiser
In this bar graph worksheet, students use the horizontal bar graph to count how much money each student collected for their fundraiser. Students answer 10 questions.
Curated OER
The Bread Shop
For this bar graphs worksheet, students study the bar graph to count the money Adam made during each day. Students answer 10 questions.
Curated OER
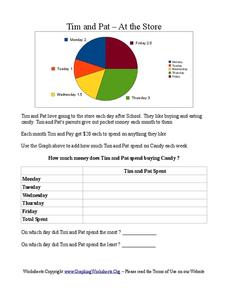
Tim and Pat - At the Store
For this pie chart worksheet, students use the pie chart to add the amount of time Tim and Pat spend buying candy each day of the week. Students answer 2 questions about the table.
Curated OER
Cindy and Linda - Selling Lemonade
In this pie charts worksheet, students use the pie chart to count how many glasses of Lemonade were sold by Cindy and Linda. Students complete the table and answer 3 questions.
Curated OER
Histograms
In this histograms worksheet, students solve 5 word problems based on a histogram of presidential ages at their inauguration. Next, students create a frequency table and a histogram based on a list of data which shows the average...
Curated OER
Coral Reef Center Math
In this math activity, students find the solutions to the math problems with the use of the graphs using the theme of coral reefs.
Curated OER
Homecoming Tickets
Students solve word problems using systems of equation. In this algebra instructional activity, students use computer and graphing to graph and analyze their solution. They solve system involving inequalities.
Curated OER
Round and Round and Round We Go!
Students investigate motion using a CBL. In this algebra lesson, students collect and graph data on a coordinate plane. They define and identify amplitude and period of conic graphs.
Curated OER
Electromagnets: Winding Things Up!
Students explore solenoids and electromagnets. After building an electromagnet, students use a TI Graphing calculator, a CBL 2 interface and a magnetic field sensor to measure the strength of a magnetic field. They create a graph of...
Curated OER
You Scratch my Back, I'll Scratch Yours
Students explore the concept of interdependence. In this integrated interdependence lesson, students interpret graphs and charts that require them to analyze the relationship between Mexico and the United States. Students also...
Curated OER
Measuring Body Angles
Learners use technology to graph and compare angles. In this geometry lesson, students range of motion in the environment. They identify the missing parts of polygons using similarity and congruence.
Curated OER
Mathematics and Ecology: Through the Window Garden
Student discover some of the ideas and concepts that make up the topic of Ecology. They read and interpret graphs to assimilate the information that is displayed. They discover the rate of increase of Carbon dioxide in the atmosphere...
Curated OER
Bar Me In
Fourth graders watch a video about constructing bar graphs. They create their own graph and interpret it.
Curated OER
Unit 2: Lesson 7
Pupils are introduced to spreadsheets. They conduct a survey of television viewing time of different shows based on different age categories. Students work in small groups. They collect, data and interpret the data from a survey.
Curated OER
Read and Write Numbers up to 100,000
Use this lengthy, and challenging, presentation in your lesson on numeracy. Pupils practice their skills in reading and writing numbers up to 100,000, interpret a variety of graphs, solve word problems, and get to use a calculator. A...
ARKive
Handling Data: African Animal Maths
Handling and processing data is a big part of what real scientists do. Provide a way for your learners to explore graphs and data related to the animals that live on the African savannah. They begin their analysis by discussing what they...
Curated OER
Historical Population Changes in the US
Students conduct research on historical population changes in the U.S. They conduct Internet research on the Historical Census Data Browser, create a bar graph and data table using a spreadsheet program, and display and interpret their...
Curated OER
Dental Detectives
First graders explore the theme of dental health and hygeine. They make tooth loss predictions, count lost teeth, and graph tooth loss. In addition, they listen to dental health stories, read online stories, create spreadsheets, and play...
Illustrative Mathematics
Influenza epidemic
This activity presents a real-world problem about an epidemic of influenza spreading through a city. Learners refer to a graph that shows the number of individuals infected in relation to the number of weeks that have elapsed since...
Inside Mathematics
House Prices
Mortgages, payments, and wages correlate with each other. The short assessment presents scatter plots for young mathematicians to interpret. Class members interpret the scatter plots of price versus payment and wage versus payment for...
Illustrative Mathematics
Invertible or Not?
What determines whether a function has an inverse? Learners investigate that criteria when they examine values in a partially completed input-output table for two different functions. The task is to complete the table so that one of the...
EngageNY
Modeling a Context from a Verbal Description (part 2)
I got a different answer, are they both correct? While working through modeling problems interpreting graphs, the question of precision is brought into the discussion. Problems are presented in which a precise answer is needed and...
It's About Time
Volcanic Hazards: Airborne Debris
Pupils interpret maps and graph data related to volcanic ash. Then they analyze the importance of wind speed and the dangers of the ash to both life, air temperature, and technology.
American Statistical Association
Scatter It! (Predict Billy’s Height)
How do doctors predict a child's future height? Scholars use one case study to determine the height of a child two years into the future. They graph the given data, determine the line of best fit, and use that to estimate the height in...


