Curated OER
Weather Analysis - Lab Activity
Ninth graders perform research in the subject of weather to answer several key questions to increase comprehension of concepts. Students use weather prediction as an application for the research.
Curated OER
LIFE ON THE MISSISSIPPI PAST AND PRESENT
Third graders explore the Mississippi River and the ways in which it is used by the communities it travels through.
Curated OER
Bradford England
Students explore the locality and diversity of culture within the Bradford District of England. Through map activities and discussion, they identify the major forms of transport, people and places in the region. Students compare and...
Smarter Balanced
Growth and Expansion of America
Despite the difficulty of travel, the US expanded significantly between the 1800s and the early 1900s. To prepare for a performance task assessment on the rapid expansion of the US in the 1800s, class members engage in a...
Curated OER
Reacting to Literature
Students summarize a book which they have read. A slide show depicting an action scene in their chosen book is created and three main characters described using a web.
Curated OER
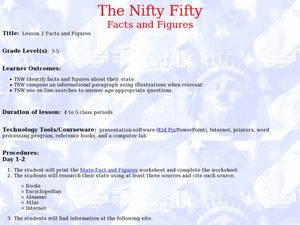
The Nifty Fifty- Facts and Figures
Young scholars explore an assigned state. In this United States geography lesson, students identify facts and figures related to a particular state. Young scholars use the Internet for research and create a PowerPoint presentation...
Curated OER
On the Track With NASCAR
Students complete a variety of activities to research stock car racing. They use the Internet to research NASCAR acronyms, schedules, results, car design and other aspects.
Living Rainforest
Finding the Rainforests
From Brazil to Indonesia, young scientists investigate the geography and climate of the world's tropical rain forests with this collection of worksheets.
Curated OER
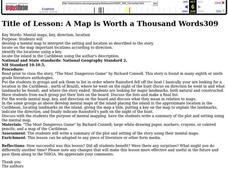
A Map is Worth a Thousand Words
Students read the story, "The Most Dangerous Game," by Richard Connell. They discuss specific parts of the story with a group and put their lists on the board. They write a summary of the plot and setting of the story.
Curated OER
Mapping Your Local Community
First graders take a walking tour of their community to discover the names of numbered locations on a premade map. They then, create their own map of the community on the computer using Kidspiration software.
Curated OER
Maps
First graders look at their classroom or school setting. They use positional word to describe where things are located in the school. Students discuss a map and why they are important. They read the story "Taylor's New School" and...
Curated OER
Using Maps To Make Public Health Decisions Case Study: Wildfires in Mexico 2000
Learners study environmental health. Using actual NOAA satellite imagery, students investigate the basic concepts of mapping. They explore the relationship between monitoring satellite images and public health decision making.
Curated OER
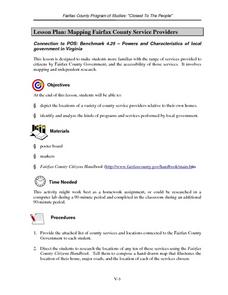
Mapping Fairfax County Service Providers
Learners brainstorm a list of services governments should have available to its citizens. Using the internet, they locate as many of these services as possible and compile a class list. They also analyze specific programs to consider...
Curated OER
Mapping Shakespeare
Twelfth graders read a Shakespearean play focusing on a character. They create "Mind Maps" of their characters and act out a selection of the play.
Curated OER
Paleogeographic Mapping (o.k. Fossils Are Neat But What Good Are They?)
Students examine how evidence from fossils can be used in paleogeographic interpretation. They gain experience in developing multiple hypotheses.
Curated OER
Mapas Bailados: Creating Visual Representations of Dances Using Maps
Third graders listen to "Frank the Monster..." and discuss the dance map on the inside cover of the book. They create their own dance map using sentence strips to record the types of movement.
Curated OER
Using My Nasa Data To Determine Volcanic Activity
Young scholars use NASA satellite data of optical depth as a tool to determine volcanic activity on Reunion Island during 2000-2001. They access the data and utilize Excel to create a graph that has optical depth as a function of time...
Curated OER
Eager to Get to Ancient Egypt
Seventh graders explore the geography of Ancient Egypt, read a story and answer questions on a web site.
Curated OER
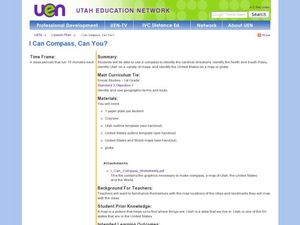
I Can Compass, Can You?
Young scholars discover how to use geographic tools. In this compass lesson, students identify cardinal directions by appropriately using compasses along with a number of various maps.
Curated OER
Elementary Mapping Activity
Young scholars build a classroom community. In this peer interaction lesson, students participate in a sociogram activity that requires them to socially interact with peers that normally they do not interact with. Young scholars write...
Curated OER
Snow Cover By Latitude
Students create graphs comparing the amount of snow cover along selected latitudes using data sets from a NASA website. They create a spreadsheet and a bar graph on the computer, and analyze the data.
Curated OER
Kids Get School Named for Obama
Students read about the renaming of a school for Barack Obama. In this political lesson, the teacher presents vocabulary words from the news article, then the students read the article and answer comprehension questions. Lesson includes...
Mathematics Assessment Project
Classifying Proportion and Non-Proportion Situations
Proportions, proportions, everywhere. Class members complete an assessment task solving problems involving proportionality. They then complete an activity classifying given situations as proportional or non-proportional.
Mathematics Assessment Project
Temperatures
As a middle school assessment task, learners first examine line graphs of monthly temperatures for two locations, and then match box plots to each line plot.


