Newspaper Association of America
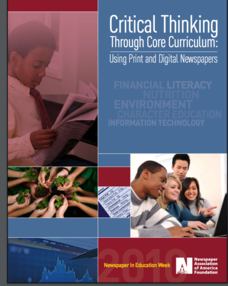
Critical Thinking through Core Curriculum: Using Print and Digital Newspapers
What is and what will be the role of newspapers in the future? Keeping this essential question in mind, class members use print, electronic, and/or web editions of newspapers, to investigate topics that include financial...
Newspaper Association of America
By the Numbers: Mathematical Connections in Newspapers for Middle-Grade Students
A cross-curricular resource teaches and reinforces mathematical concepts with several activities that use parts of a newspaper. Scholars use scavenger hunts to find the different ways math is used in the paper along with using data...
Newspaper Association of America
Power Pack: Lessons in Civics, Math, and Fine Arts
Newspaper in Education (NIE) Week honors the contributions of the newspaper and is celebrated in the resource within a civics, mathematics, and fine arts setting. The resource represents every grade from 3rd to 12th with questions...
Curated OER
A Newspaper?
Sixth graders use newspapers to investigate fractions. They work in small groups to categorize articles, measure them with the grid transparency, and calculate the values represented. Afterward, they write a reflective essay on the role...
University of Kansas
Newspaper in the Classroom
Newspapers aren't only for reading—they're for learning skills, too! A journalism unit provides three lessons each for primary, intermediate, and secondary grades. Lessons include objectives, materials, vocabulary, and procedure, and...
Curated OER
Using Graphical Displays to Depict Health Trends in America's Youth
Identify the different types of graphs and when they are used. Learners will research a specific health issue facing teens today. They then develop a survey, collect and analyze data and present their findings in class. This is a...
Curated OER
When Are We Ever Going To Use This?
Students explore the relationships between fractions, decimals, and percents in a real-world context. They examine examples of percents from magazines and newspapers, and create posters that depict the use of percents in articles and...
Curated OER
Using Data Analysis to Review Linear Functions
Using either data provided or data that has been collected, young mathematicians graph linear functions to best fit their scatterplot. They also analyze their data and make predicitons based on the data. This lesson is intended as a...
Education World
Predicting Pumpkins
If you want more pumpkin seeds, you should get a bigger pumpkin—right? Young harvesters use estimation skills to make a hypothesis about how many seeds they will find in a pumpkin before examining the real number inside.
Curated OER
The Power of Graphical Display: How to Use Graphs to Justify a Position, Prove a Point, or Mislead the Viewer
Analyze different types of graphs with learners. They conduct a survey and determine the mean, median and mode. They then identify different techniques for collecting data.
Curated OER
Graphs
Eighth graders analyze graphs on a worksheet and in newspapers and magazines. In this graphs lesson plan, 8th graders also record their thoughts in a journal.
Curated OER
Problem Solving
Fifth graders read and write equations. In this equation writing lesson, 5th graders use real life scenarios to write equations. Students use manipulatives, draw pictures and make tables to understand how to write equations. Students...
Curated OER
Information at a Glance - Using Tables in Mathematics
Students create table to display GED Testing data located in paragraph provided by teacher, use information in table to create appropriate graph, and determine percentage difference between passing scores and failing scores.
Curated OER
New York City Delights: The Taxi Cab
You set the rate! Step into the shoes of a taxi driver in New York City, and also pretend to be a person who uses taxis to get around town. The class will conduct collaborative research to learn about the history of taxis. Then, they...
Curated OER
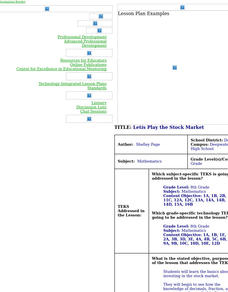
Let's Play the Stock Market
Eighth graders explore the basics about investing in the stock market, begin to see how the knowledge of decimals, fraction, and percents can be applied to financial profit or loss if investing in the market, and track their stocks using...
Curated OER
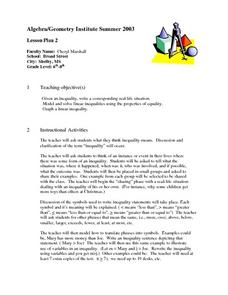
Lesson Plan 2: Linear Inequalities
Students investigate linear inequalities and the associated symbols. After a teacher demonstration, they translate given phrases into symbols. Students solve and graph solutions to linear inequalities. Using newspapers, they locate...
Curated OER
It's Your Life - Safe or Sorry/Safety Issues
Students examine and chart data about safety hazards and unsafe situations. In this safety hazard instructional activity, students examine newspapers and web sites to investigate injuries from safety hazards. They make a spreadsheet...
Curated OER
Sort It Out
Elementary schoolers engage in a game of logical reasoning called Secret Sort. A Venn diagram is used as a way to sort objects. This resource would be a great way to introduce the Venn diagram (maybe the most famous, and most-useful...
Curated OER
Graph It!
There is more than one way to represent data! Learners explore ways to represent data. They examine stacked graphs, histograms, and line plots. They conduct surveys and use stacked graphs, histograms, or line plots to chart the data they...
Curated OER
Calculating the Cost of Living
Bring Consumer Mathematics and Economics to life with this lesson plan, where learners investigate personal finance and budgeting. They use the newspaper’s classified section to determine a future job and potential earnings and determine...
Curated OER
Cutting Costs With Coupons.
Students clip coupons for food items, create a menu using those items, and add up the total savings. They correctly calculate the total amount of money that would be saved if they used the coupons.
EduGAINs
Data Management
Using a carousel activity, class members gain an understanding of the idea of inferences by using pictures then connecting them to mathematics. Groups discuss their individual problems prior to sharing them with the entire class....
Bowland
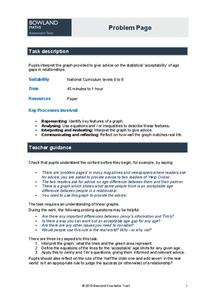
Problem Page
Future mathematicians use a given graph to answer a question about age differences in relationships. Along the way, they must find the equation and inequality of given graphs.
Curated OER
Money: Bucks, Banks, and Business
Put economics and currency exchange rates into a real-world application kids can understand. They'll compare bus fares from various cities around the world. Each child selects three international cities to research. They determine the...
Other popular searches
- Main Idea Using Newspapers
- Lessons on Using Newspapers
- Using Newspapers in Geograpy
- Summary Using Newspapers
- Activities Using Newspapers
- Using Newspapers in Geography
- Games Using Newspapers
- Lesson Plans Using Newspapers
