Curated OER
Student News And Weather Channel
Fabulous! Your 5th graders should love this project. As an ongoing lesson throughout the year students use temperature probes to record outside temperature and then document their data using spreadsheets. They use their weather data and...
Code.org
Making Data Visualizations
Relax ... now visualize the data. Introduce pupils to creating charts from a single data set. Using chart tools included in spreadsheet programs class members create data visualizations that display data. The...
Curated OER
Using Spreadsheets and Graphs
Third graders explore mathematics by utilizing computers. In this graphing lesson, 3rd graders gather class data based on a particular topic such as the "favorite candy" of the class. Students utilize this information and computers to...
Curated OER
Basic Excel
Students explore basic Excel spreadsheets. In this spreadsheet lesson plan, students enter Alaska weather information and perform calculations. Students title the columns on the spreadsheet and format the cells. ...
Curated OER
Escape Velocity
Sixth graders create/use spreadsheets to solve real-world problems, explore patterns, make predictions, select/explain most appropriate types of graph to display data, use information to create product, and have basic understanding of...
Council for Economic Education
Loan Amortization - Mortgage
When you buy a home for $100,000, you pay $100,000—right? On the list of important things for individuals to understand, the lesson presents the concept of interest rates and loan amortization using spreadsheets and online sources....
Curated OER
Spreadsheets and Database in Social Studies
Fifth graders create/use spreadsheets to solve real-world problems, explore patterns and make predictions, select/explain most appropriate types of graph to display data, and enter data into a prepared spreadsheet to perform calculations.
Curated OER
Spreadsheet formulas
Learners, while in the computer lab, practice using formulas, print options, functions and adjusting column widths while interacting with a spreadsheet program. They modify and use spreadsheets, after being given a scenario, to solve...
Curated OER
Basic Algebra and Computers: Spreadsheets, Charts, and Simple Line Graphs
Students, while in the computer lab, assess how to use Microsoft Excel as a "graphing calculator." They view visual representations of line graphs in a Cartesian plane while incorporating basic skills for using Excel productively.
Curated OER
Hopes and Dreams: A Spreadsheet Lesson Using Excel
Fourth graders read "The Far Away Drawer" by Harriet Diller and discuss the story as a class. After discussion, 4th graders create a t-shirt GLYPH about their hopes and dreams,share their information with the class and create spreadsheets.
Bowland
Outbreak: Infection Detection
Explore the mathematics of infection outbreaks with activities that ask learners to use coordinate grids to locate infected patients. They calculate amounts of ingredients for antidotes and determine which groups of people should be...
EngageNY
Credit Cards
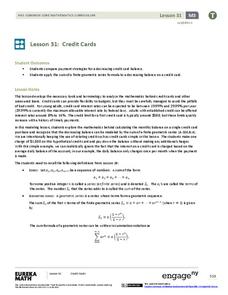
Teach adolescents to use credit responsibly. The 32nd installment of a 35-part module covers how to calculate credit card payments using a geometric series. It teaches terminology and concepts necessary to understand credit card debt.
Curated OER
The Solstices
Compare surface temperatures when the solstice occurs in the different hemispheres. Young scientists draw conclusions from their investigation of data collected using spreadsheets and a globe.
Curated OER
Interest Calculation and Spreadsheets
Students, while in the computer lab working on a spreadsheet program, calculate interest and accumulated value of a savings plan. They follow specific directives on how to create their spreadsheets. At the end of the lesson they print...
Curated OER
The Viewing Tube
Looking for an excellent instructional activity that incorporates math, science, and technology? Groups of three learners use a viewing tube to perform an experiment, and discover how to organize their data into an Excel...
Curated OER
Using Computers to Produce Spreadsheets and Bar Graphs
Students review graphing terminology and how to plot data points, how to input data into a spreadsheet, and how to make a chart using a computer.
Curated OER
Temperature High and Lows
Students gather high and low temperature readings through email. In this temperature graphing lesson, students use a spreadsheet to input data for a graph. students interpret the graphs to compare and contrast the data from different...
Curated OER
Using a Spreadsheet to Understand Density
Students use density to identify what metal a gold colored weight is made of. They use a spreadsheet to graph the experimental density of common metals and compare the know densities to their calculated density of the known metal.
Curated OER
Baseball Relationships - Using Scatter Plots
Students use graphing calculators to create scatter plots of given baseball data. They also determine percentages and ratios, slope, y-intercepts, etc. all using baseball data and statistics.
Curated OER
Fast Food Survey Using Bar Graphs
Second graders create a bar graph to pictorically represent the data collected from a survey of students. They use Excel to electronically create the graphs and data tallies. They then interpret their data using sentences to explain.
Curated OER
Using Excel to Reference and Graph Live Data from a Web Site
Middle schoolers collect live buoy data about water temperatures in the Gulf of Mexico from the Internet and work individually to organize their data and create a line graph using Excel Spreadsheet. Students analyze their data and...
Curated OER
Moving Day!
Eighth graders continue their geometry unit by focusing on volume. Using data, they create a spreadsheet, estimate and calculate volume. They solve real-life problems and round their answers to the hundredths place. They also practice...
Curated OER
Louisville's Best Field Day Park
Students create a survey to hand out to determine the best field day park. Using their local area, they select five parks, if possible, that meet the criteria and calculate the distance and estimated time travel. They use this...
Bowland
Speed Cameras
Do speed cameras help reduce accidents? Scholars investigate this question using a series of spreadsheet activities. Along the way, they learn about randomness, probability, and statistical analysis.


