National Wildlife Federation
I Speak for the Polar Bears!
Climate change and weather extremes impact every species, but this instructional activity focuses on how these changes effect polar bears. After learning about the animal, scholars create maps of snow-ice coverage and examine the yearly...
EngageNY
Comparing Distributions
Data distributions can be compared in terms of center, variability, and shape. Two exploratory challenges present data in two different displays to compare. The displays of histograms and box plots require different comparisons based...
EngageNY
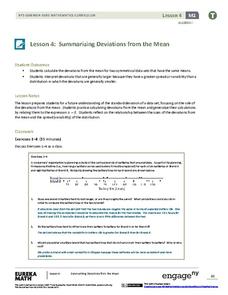
Summarizing Deviations from the Mean
Through a series of problems, learners determine the variability of a data set by looking at the deviations from the mean. Estimating means of larger data sets presented in histograms and providing a way to calculate an estimate round...
McGraw Hill
Lesson 12: Absolute Mean Deviation
Learn a different way to determine variability. An informative lesson provides directions on how to calculate the mean absolute deviation of a data set. Pupils use examples to learn the process and then practice finding the mean absolute...
Illustrative Mathematics
Buttons: Statistical Questions
Here is a nice activity about recognizing the difference between a statistical question and answer and one that anticipates a fixed answer. From this, your future statisticians will develop an understanding of variability and be able to...
Statistics Education Web
Did I Trap the Median?
One of the key questions in statistics is whether the results are good enough. Use an activity to help pupils understand the importance of sample size and the effect it has on variability. Groups collect their own sample data and compare...
Curated OER
Sexual Reproduction and Meiosis
In this biology worksheet, 9th graders create one chromosome using a red plasticine and another using blue plasticine. Then they illustrate different ways of crossing over, including double crossovers. Students also explain genetic...
Curated OER
Kildare, USA: An Environmental Health Simulation
Your biology class plays the role of epidemiologist when a mysterious illness breaks out in Kildare, USA. Using interviews with doctors, patients, and local citizens, maps, the results from different materials sampling, they work to...
EngageNY
Margin of Error When Estimating a Population Mean (part 2)
Don't leave your classes vulnerable in their calculations! Help them understand the importance of calculating a margin of error to represent the variability in their sample mean.
EngageNY
Margin of Error When Estimating a Population Mean (part 1)
We know that sample data varies — it's time to quantify that variability! After calculating a sample mean, pupils calculate the margin of error. They repeat the process with a greater number of sample means and compare the results.
Mathed Up!
Stem and Leaf Diagrams
Order the data within a stem-and-leaf display. Pupils take data and create and ordered stem-and-leaf diagrams, including the key. Participants take their data and determine answers about the information. Class members then find measures...
US Department of Commerce
Census in Counties - Describing and Comparing Histograms to Understand American Life
Use graphs to interpret life in 136 counties. Pupils analyze histograms and describe the shapes of the distributions of data collected from several counties on different aspects of life. Scholars make predictions on the difference in...
Personal Genetics Education Project
How Does Ancestry Testing Work? Exploring Admixture Testing
Find out the science behind ancestry testing! Investigators watch a video exploring how ancestry works before participating in a hands-on group activity. Scholars role play scientists while learning about testing protocols and test...
American Statistical Association
How Long Are the Words in the Gettysburg Address?
It's 268 words, but one only needs to consider 10 of them at a time. A data collection and analysis activity has learners investigate the lengths of words in the Gettysburg Address. They first self-select a sample of 10 words and...
Curated OER
Mean and Standard Deviation
Get two activities with one lesson plan. The first lesson plan, is appropriate for grades 6-12 and takes about 20 minutes. It introduces the concept of measures of central tendency, primarily the mean, and discusses its uses as well as...
Curated OER
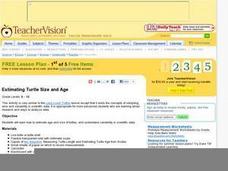
Estimating Turtle Size and Age
Students investigate how to estimate the age and size of turtles, and examine variability in scientific data. They read an informational handout, identify the parts of the shell, measure the shell and estimate the age, and record the...
Curated OER
Evolution
In this evolution worksheet, students review genetic variability, gene mutations, biodiversity and adaptations. This worksheet has 22 fill in the blank and 10 short answer questions.
EngageNY
Interpreting the Standard Deviation
Does standard deviation work for non-symmetrical distributions, and what does it mean? Through the use of examples, high schoolers determine the standard deviation of a variety of distributions and interpret its meaning. Problems require...
EngageNY
Displaying a Data Distribution
Pupils analyze a display of data and review dot plots to make general observations about the highest, lowest, common, and the center of the data. To finish, learners match dot plots to scenarios.
Curated OER
Statistical Process Control
In this statistical process control activity, students solve and complete 15 various types of problems. First, they estimate the standard deviation of the given process. Then, students use the target value as a center line and draw a...
Curated OER
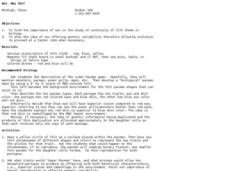
But, Why Sex?
Students investigate the importance of sexual reproduction in evolution. In this sexual reproduction lesson plan, students simulate species with two traits: eye and skin color. They determine what characteristics are beneficial for the...
Curated OER
Introduction to Measurement
Students are able to observe and measure the variability in the length of the forearm and the length of the foot and to test a common belief of the foot is equal to the length of the forearm.
American Psychological Association
A Tasty Sample(r): Teaching about Sampling Using M&M’s
Here's a sweet activity! As part of a study of psychological research methods and statistic gathering, individuals develop a hypothesis about the number of each color of M&Ms in a fun-size package. They then count the number of each...
Curated OER
the Potential Consequences of Climate Variability And Change
Learners analyze the consequences of changing variables on a system. Changes in a model are measured and recorded and conclusions drawn based on the data provided in this six lessons unit.
Other popular searches
- Measures of Variability
- Genetic Variability
- Proportion of Variability
- Random Variability
- Habitat Variability
- Climate Variability
- Statistical Variability
- Inherent Variability


