EngageNY
Random Sampling
Sample pennies to gain an understanding of their ages. The 16th installment of a 25-part series requires groups to collect samples from a jar of pennies. Pupils compare the distribution of their samples with the distribution of the...
EngageNY
Estimating a Population Proportion
Find the percent of middle schoolers who want the ability to freeze time. The 21st installment in a series of 25 has groups collect a random sample of respondents who answer a question about superpowers. Using sample statistics,...
EngageNY
More Practice with Box Plots
Don't just think outside of the box — read outside of it! The 15th lesson in a 22-part unit provides pupils more work with box plots. Learners read the box plots to estimate the five-number summary and interpret it within the context....
Statistics Education Web
The Egg Roulette Game
Hard boiled or raw? Which egg will you get? A hands-on activity has scholars explore the impact of conditional probability. Based on a skit from the Tonight Show, pupils model the selection of the two types of eggs using beads. They...
Curated OER
Mark, Recapture, Sampling
Learners conduct a simulation to explore how scientists estimate the size of animal populations. They analyze a random sample and then extrapolate those results to a larger population. Additionally, they will apply the principals of...
Curated OER
Cinderella Folk Tales: Variations in Character
Young scholars read a variety of Cinderella tales from different cultures. They discuss the differences in character, plot, and conflict resolution in the stories from different countries.
Curated OER
Cinderella Folk Tales: Variations in Plot and Setting
Students examine plot and setting of Cinderella, and how it changes as it is translated into different cultures, discuss universal literary elements of the Cinderella story, and write narratives with original settings and plots...
Curated OER
# 12 Using Bottled Water as a Problem Solving Exercise in Chemical Identification
Students work in groups of two or three, groups are given four unidentified bottled waters in unmarked containers and the chemical characteristics taken from the label on the bottled waters. They devise and carry out a plan to match the...
Curated OER
Fish and Zooplankton Through Remote Sensing
Ecology aces examine sea surface temperature maps and relate temperatures to concentration in fish and zooplankton populations. Take your class to a computer lab and provide experience with actual remote sensing data. Some of the links...
Curated OER
Fish and zooplankton habitat through remote sensing
Students are exposed to the variety of ways in which scientist use remote sensing and it used in everyday life. They investigate about zooplankton and fish. Students list the two important groups of organisms in both aquatic and marine...
Curated OER
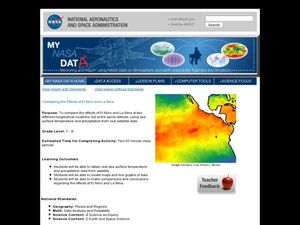
Comparing the Effects of El Nino and La Nina
Students examine the differences between an El Nino and La Nina year. For this investigative lesson students create maps and graphs of the data they obtained.
Curated OER
Changing Planet: Withering Plants - Stressing Over Lost Water
Expectant earth scientists examine the bottom side of a leaf and learn the role of the stomata. They consider the gas exchange that occurs through these structures and relate how the climate is changing to its impact on food crops. This...
Curated OER
Evolution
Explore the concept of evolution and cell biology; your class can work in groups to use the internet to view websites on evolution, take a quiz, and complete a lab activity.
American Statistical Association
How Long is 30 Seconds?
Is time on your side? Pupils come up with an experiment to test whether their classmates can guess how long it takes for 30 seconds to elapse. They divide the class data into two groups, create box-and-whisker plots, and analyze the...
American Statistical Association
Armspans
Young mathematicians collect data on the arm spans of classmates. Then they sort the data by measures of center, spread, and standard deviation. Finally, they compare groups, such as boys and girls, to interpret any differences.
Statistics Education Web
It Creeps. It Crawls. Watch Out For The Blob!
How do you find the area of an irregular shape? Class members calculate the area of an irregular shape by finding the area of a random sampling of the shape. Individuals then utilize a confidence interval to improve accuracy and use a...
Illustrative Mathematics
Offensive Linemen
Comparing college football teams, Division I is said to have heavier lineman than Division III. Your mathematicians are given data from two different divisions and will have to interpret a dotplot and calculate the difference in weight...
Curated OER
College Athletes
When more basketball players are taller than field hockey players at a school, is it safe to say that in general they are always taller? The activity takes data from two college teams and your learners will be able to answer questions...
American College of Sports Medicine
Selecting and Effectively Using Hydration for Fitness
How much water does your body lose during exercise? How much should you hydrate during and after exercise? Address the importance of hydration with your young athletes using this informative handout.
Stats Monkey
Everything I Ever Needed to Learn about AP Statistics I Learned from a Bag of M and M's®
Candy is always a good motivator! Use this collection of M&M's® experiments to introduce statistics topics, including mean, standard deviation, nonlinear transformation, and many more. The use of a hands-on model with these AP...
Curated OER
Teaching About Plate Tectonics and Faulting Using Foam Models
Young scientists learn about plate tectonics and the three different types of faults (normal, reverse, and strike-slip) using foam models. The activity also covers common types of locations where these faults are found.
EngageNY
Margin of Error When Estimating a Population Proportion (part 1)
Use the power of mathematics to find the number of red chips in a bag — it's a little like magic! The activity asks learners to collect data to determine the percentage of red chips in a bag. They calculate the margin of error and...
EngageNY
Margin of Error When Estimating a Population Proportion (part 2)
Error does not mean something went wrong! Learners complete a problem from beginning to end using concepts developed throughout the last five lessons. They begin with a set of data, determine a population proportion, analyze their result...
It's About Time
Oil and Gas Production
Would you consider a power failure a current event? This lesson uses multiple experiments, guided inquiry activities, and group discussions to cover the topics of oil and gas production. This is the seventh lesson in a series of eight.
Other popular searches
- Measures of Variability
- Genetic Variability
- Proportion of Variability
- Random Variability
- Habitat Variability
- Climate Variability
- Statistical Variability
- Inherent Variability


