Curated OER
Curveball vs. Fastball
Students graph the relationship between the release point and the final position of curveballs and fastballs thrown by both right and left handers given a constant speed, and explain the relationships illustrated by the graphs of data.
Curated OER
The Baseball and Air
Young scholars use Curveball to complete the activity to determine how the speed of airstreams changes in relation to changes in the distance of the airstream from the center of the baseball.
Curated OER
Lift vs. Airspeed
Students, after reading the explanation given below, use FoilSim and a graphing calculator to complete the activity to determine the relationship between airspeed and lift of an object by interpreting data.
Curated OER
Characteristics of Lift and Wing Area
Learners use FoilSim to complete the activity and investigate the factors that affect lift and how wing area and lift are related.
Curated OER
Wing Specifications
Ninth graders use FoilSim to fulfill the specifications of a given airfoil (wing) and plot and interpret graphs.
Curated OER
Wing Area Effects Problem Set
Students read an explanation from a NASA Web-based textbook on lift and an explanation on the FoilSim software package given below. They use FoilSim to evaluate the relationship between wing area and lift.
Curated OER
Velocity Effects Problem Set
Learners, after reading an explanation on lift from a NASA Web-based textbook and an explanation on the FoilSim software package given below, use FoilSim to evaluate the relationship between velocity and lift.
Curated OER
The Bigger they Are . . .
Students do a variety of data analyses of real-life basketball statistics from the NBA. They chart and graph rebounding, scoring, shot blocking and steals data which are gathered from the newspaper sports section.
Curated OER
Distribution of children living at home
Students examine census data to evaluate the number of students of certain ages living at home. This data is then used to determine the need for day care, or other social programs. They use this information to explore social policies.
Curated OER
Seasons' Journey : Putting it All Together
Third graders complete a diagram of the revolution of the earth around the sun and write a one paragraph explanation of the factors that cause seasons.
Curated OER
Seasons' Journey: As the World Turns
Fourth graders explore the earth's revolution around the sun and the changes in weather that follow this motion.
Curated OER
Lesson 3: Understanding Population Growth
Students explain population growth in Maryland and its relationship with age structure, household growth and consumption of land.
Curated OER
Physical Difference and Classification
Students use a microscope and observation skills to compare and contrast several physical properties and develop a classification system.
Curated OER
Escape! Survival of the Fittest Grasshopper
Fourth graders, in groups, design a paperclip grasshopper. They determine its ability to survive a prey by jumping high, far, or with a distracting behavior.
Curated OER
Follow That Graph
Young scholars investigate the graphs of six trigonometric functions. They discover how changes in the equation of the basic function affect the graph of the function.
Curated OER
What's the Attraction?
Students experiment with magnets to determine the distances at which they attract and repel each other.
Curated OER
Newton's Third Law and Aircraft Propulsion
Students research propulsion, graph data, and interpret the results.
Curated OER
Sounds Like Science - Bottle Organ
Students see that by manipulating sound we can arrange a series of notes referred to as a musical scale. They explain the relationship between pitches and notes. They compare the sounds of different-sized bottles.
Curated OER
Bears
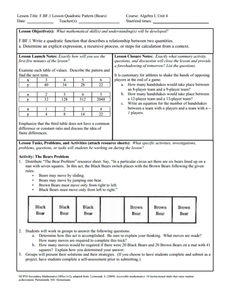
Learners complete a variety of bear-related activities. They sort and graph teddy bears, distinguish between real and non-real bears and research bear life cycles and habitats.


