Curated OER
Probability
Here is a classic activity used to introduce your class to the concept of probability and data collection. They will roll one die 30 times, then record and discuss the results. Great introduction, but too shallow to be considered a...
Curated OER
Probability and Statistics
Elementary schoolers choose from a host of activities to investigate probability and statistics. They complete worksheets, create 3-D graphs, and play graph bingo. They make weather predictions and list all the possibilities before going...
Curated OER
Probability: The Study of Chance
Students conduct an experiment, determine if a game is fair, and collect data. They interpret data, then display line graph. They conduct analysis of game for probability.
Curated OER
Weather, Data, Graphs and Maps
Students collect data on the weather, graph and analyze it. In this algebra lesson plan, students interpret maps and are able to better plan their days based on the weather reading. They make predictions based on the type of clouds they...
Curated OER
Chances Are
Upper graders examine the concept of probability. They collect data and create a bar graph. They must interpret the data as well. Everyone engages in hands-on games and activities which lead them to predict possible outcomes for a...
Chicago Botanic Garden
Unit 2 Pre-test, Grades 7– 9
This pre-assessment launches a unit on climate change and weather. 15 questions, both short answer and multiple choice, asses the classes' knowledge about these concepts.
Curated OER
Figure This! Math Challenges for Families
Young mathematicians complete a family math challenge packet. They will complete a packet of mixed math activities. They work with graphs, comparing numerical data, tessellations, and probability.
Radford University
A Change in the Weather
Explore the power of mathematics through this two-week statistics unit. Pupils learn about several climate-related issues and complete surveys that communicate their perceptions. They graph both univariate and bivariate data and use...
Curated OER
Probability With a Random Drawing
Students define probability, and predict, record, and discuss outcomes from a random drawing, then identify most likely and least likely outcomes. They conduct a random drawing, record the data on a data chart, analyze the data, and...
Curated OER
Probability: The Study of Chance
Students practice the basic principles of probability by conducting an experiment, determining if a game is fair, collecting data, interpreting data, displaying data, conducting analysis, and stating and applying the rule for probability.
Curated OER
What Are My Chances?
Students calculate probability. In this lesson on probability, students use given data to calculate to chances of a given event occurring. Many of the calculations in this lesson are applicable to daily life.
Rice University
Algebra and Trigonometry
Move on into trigonometry. An informative eBook takes the content of a College Algebra course and adds more relating to trigonometry and trigonometric functions. The content organization allows pupils to build upon their learning by...
Rice University
College Algebra
Is there more to college algebra than this? Even though the eBook is designed for a college algebra course, there are several topics that align to Algebra II or Pre-calculus courses. Topics begin with linear equation and inequalities,...
Curated OER
Probability: the Study of Chance
Students experiment to determine if a game is fair, collect data, interpret data, display data, and state and apply the rule for probability. Students use a simple game for this experiment.
Curated OER
Water Cycle, Weather, and Climate
Eighth graders investigate the water cycle and its processes. They examine temperature and precipiation data to classify climate of ten cities. They then create a climate map of the world.
Curated OER
Let's Take a Chance!
Learners investigate probability and the chance of an even happening. In this algebra lesson, students incorporate their knowledge of probability to solve problems and relate it to the real world. They learn to make decisions based on data.
Curated OER
Weather Conditions During the Fall Monarch Migration
Students keep detailed weather records during the fall migration of the monarch butterfly. They compare weather conditions to the days they do and do not see monarchs. As a class, they graph and analyze data and send it to a university...
Curated OER
Weather Conditions During the Spring Monarch Migration
Middle schoolers keep detailed weather records during the spring migration of the monarch butterfly. To keep track of the weather, students utilyze weather reports and instuments such as anemometers, compasses, thermometers and rain gauges.
Curated OER
Data Analysis and Measurement: Ahead, Above the Clouds
Students explore and discuss hurricanes, and examine how meteorologists, weather officers, and NASA researchers use measurement and data analysis to predict severe weather. They plot points on coordinate map, classify hurricanes...
Curated OER
Bar Me In
Fourth graders watch a video about constructing bar graphs. They create their own graph and interpret it.
Curated OER
Weather Conditions During the Spring Monarch Migration
High schoolers keep a detailed record of weather patterns during the spring migration of the monarch butterfly. The use of weather reports is used to form a class data sheet. This lesson connects to the skills of graphing and critical...
Curated OER
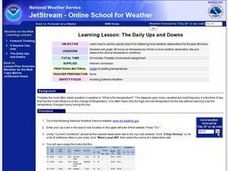
Learning Lesson: Ups and Downs
Students use the internet to find the air temperatures in their area. They create a graph based on the data. They analyze the data and examine tips for avoiding extreme weather.
Curated OER
Temperature High and Lows
Students gather high and low temperature readings through email. In this temperature graphing lesson, students use a spreadsheet to input data for a graph. students interpret the graphs to compare and contrast the data from different...
Curated OER
Investigating Median, Mode, and Mean
Students develop strategies to organize data while following teacher demonstration. They calculate the mean, median and mode of a data set while determining the relationships between the numbers. They analyze data from tables and double...


