Curated OER
Under the Weather
Students review mean, median, mode, and range while using the newspaper to answer weather questions.
Curated OER
Weather Maps
Students interpret information on a weather map in order to construct a graph, and discuss how the weather impacts their lives.
Curated OER
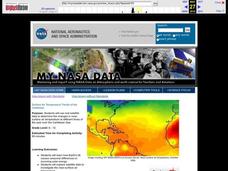
Surface Air Temperature Trends of the Caribbean
Students investigate the seasonal changes to sea surface and near-surface air temperatures near the equator. They use actual satellite data to track and graph the differences in air and sea temperatures during different seasons in the...
Curated OER
The Effect of Rain on Morning Temperatures
Eighth graders study the effects of the water cycle. They create a graph of the air temperature versus solar radiation on a rainy and clear 24 hour period using data from a provided link. Afterward, they answer questions to determine the...
Curated OER
Weather
Students read a weather map. Using the local newspaper, Columbus Dispatch, small groups investigate that air has pressure and that temperature and pressure are inversely related in weather. They display their findings on a graph or...
Curated OER
I'm a Weather Watcher Watching plants grow by......my,my,my
Young scholars investigate how weather affects how plants grow. They collect data on weather and plant growth for a week and display the data on a graph. For a culminating experience they design a movie using software that shows plant...
Curated OER
Watching the Weather
Students examine the weather. They discover the conflict between man and nature caused by the changes in weather and the impact it has upon their lives. Students explore weather folklore. They write a report on the weather. ...
Curated OER
Weather Watchers
Students practice using objective and quantitative means to describe and compare the weather. They compile weather conditions and create a spreadsheet to record their findings.
Curated OER
Exploring Literature And Weather Through Chirps
Students explore using crickets' chirps to calculate temperature. They read "Cricket in Times Square" and "The Quiet Cricket," read and discuss a Cricket eBook, develop a formula and calculate temperature using cricket chirps, and graph...
Curated OER
The Air Up There
In this data collection and analysis lesson, students observe and graph the weather conditions during one school week, then calculate the average weather temperature. Extensions are included.
Curated OER
High Mountain Retreat
Learners explore and analyze atmospheric conditions for a high mountain retreat. They examine the relationship between altitude, atmospheric pressure, temperature and humidity at a particular location. In addition, they write reports...
Curated OER
Let the Weather Help You Dress
Students observe weather daily for at least a month and graph the weather for one month. Then they use weather vocabulary such as sunny, windy, rainy, stormy, cold, snowy, foggy, and hot, and share their predictions about weather. ...
Curated OER
Fahrenheit Follies
Second graders analyze the effects of sunlight on a glass of water by using the thermometer to measure its temperature. They predict and measure the difference between water outside in the sun and shade and inside. They role-play a game...
Curated OER
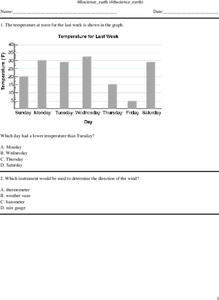
Earth Science
In this Earth science worksheet, 4th graders answer multiple choice questions about temperature, weather instruments, heat, light, and more. Students complete 25 questions.
Curated OER
Sunlight & Soil
In this soil condition worksheet, students record the soil and air temperature as well as the day length and cloud cover in a small outside area for two weeks. They complete 5 short answer questions and draw graphs of the data.
Curated OER
Bar Graphs
Students perform operations and graph their data using charts and bar graphs. In this algebra lesson, students follow specific steps to make a bar graph. They create a survey about people favorite things and plot their data from the...
Curated OER
Tracking Temperature
Students investigate the concept of temperature and how it has the tendency to fluctuate. They record the temperature as a class on a daily basis for a long period of time. The data is charted and then at a designated time students...
Curated OER
Weather Report
Students prepare a weather script for a broadcast. In this weather broadcasting lesson, student record the present temperature, high temperature, a sky watch, and the current moon phase to be presented in a school broadcast at the...
Curated OER
Weather Conditions During the Spring Monarch Migration
Students keep detailed weather records during the spring migration of the monarch butterfly. To keep track of the weather, students utilyze weather reports and instuments such as anemometers, compasses, thermometers and rain gauges.
Curated OER
Seasonal Graphs
In this math worksheet, learners create a graph using the data recorded from the local newspaper concerning local temperatures.
Chicago Botanic Garden
Climate Change Around the World
You know climate change is happening when you see a bee take off its yellow jacket. Part four in a series of five lessons explores all factors affecting climate change: temperature, cloud cover, precipitation, and carbon dioxide. By...
Curated OER
"Graphing Your Motion"
Students study the concepts of motion, velocity, and acceleration through graphing their own movement using LoggerPro. They explain the difference between speed and velocity using the weather vane example. They discover the difference...
Curated OER
Aspects of Weather
Learners recognize and observe weather phenomena. In this four part weather instructional activity, students are introduced to weather symbols through a story, then use a thermometer to measure water temperature. Next, learners observe...
Curated OER
Graph and Compare the Adventure's Temperature Vs. Local Temperature
Students explore the concept graphing data. In this graphing data lesson, students use weather data from their local weather and some other city and graph them. Students plot the local weather vs. another city. Students record...


