Captain Planet Foundation
Square Foot Fall Garden
First graders learn the basic needs of plants and identify geometric shapes while planting a fall garden. Combining math and science in one activity, the resource guides kids through starting their class garden as they...
NASA
Hurricanes and Hot Towers with TRMM
Take cover because a wild presentation on hurricanes is about to make landfall in your classroom! An outstanding PowerPoint presentation is the centerpiece of this lesson. Not only does it provide information and photographs, but several...
Curated OER
Petro Products
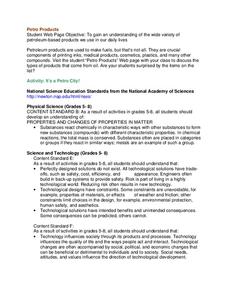
In this petroleum products worksheet, students are given the components of crude oil and they graph the various products found in a 50 gallon barrel. Students complete an activity to determine if they have collected cards that represent...
Curated OER
What Is El Niño?
Students access information at remote sites using telecommunications, identify impacts by reviewing past El Ni??o events, make and use scale drawings, maps, and maps symbols to find locations and describe relationships.
Redefining Progress
Have and Have-Not
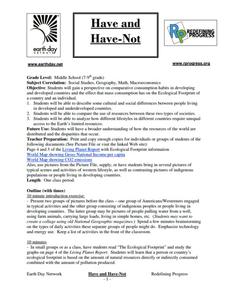
Is there a correlation between a country's wealth and the extent of its ecological footprint? What exactly constitutes an ecological footprint, and how does one country stack up against the rest? This is a unique instructional activity...
Captain Planet Foundation
Fall into Healthy Shapes
Kindergartners identify geometric shapes by planting a fall garden. They start their seeds in containers that have different shapes, and keep track of their plants based on those shapes. This brilliantly designed and incredibly thorough...
Curated OER
Tens! Hundreds! Thousands!!! of Tons
Fifth graders take a close look at the types of ships that travel through the Hudson River Valley on the Hudson River. They utilize worksheets embedded in the plan in order to answer questions about exactly what is being shipped, and how...
Teach Engineering
Where Are the Plastics Near Me? (Mapping the Data)
The last activity in a nine-part series has teams create a Google Earth map using the data they collected during a field trip. Using the map, groups analyze the results and make adjustments to the map to reflect their analysis. A short...
Teach Engineering
Air Pressure
Investigate what is pushing on us. An intriguing lesson has pupils calculate the amount of force on various squares due to air pressure. Using the data, individuals create a graph in the third lesson of the Up, Up and Away unit...
Curated OER
Global Warming
A series of independent learning activities teaches learners about global warming as it relates to economics and industrialization. The culminating project requires them to create a multimedia presentation identifying the problems,...
Curated OER
Understanding Biodiversity Via Ecological Footprints
Sixth graders investigate the ways in which human beings impact the environment and ecology through the calculation of their own ecological footprint, discussion questions pertaining to biodiversity and potential imbalance hazards, and...
Intel
Energy Innovations
Collaborative groups examine the importance of energy resources on quality of life by researching different energy sources and alternative energy sources through data analysis. They make a comparison of different countries and cultures,...
Bowland
Mission: Rainforest
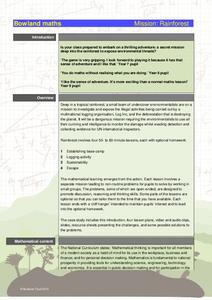
Young environmentally conscious mathematicians solve a variety of problems related to the central theme of uncovering illegal logging activities. They determine a base camp based on given constraints, investigate logging activities and...
Teach Engineering
Energy Sources Research
Turn your pupils into teachers! Here is a lesson that requires groups to research an energy source with the provided handout, create a poster, and present their information to the class. Connections are made to practical aspects of...
Curated OER
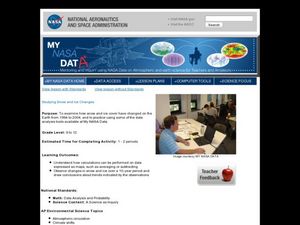
Studying Snow and Ice Changes
Students compare the change in snow and ice over a 10 year period. In this environmental science lesson, students use the live data on the NASA site to study and compare the monthly snow and ice amounts on a map of the entire...
Alcohol Education Trust
Talk About Alcohol: How Much Alcohol is in a Drink?
Introduce your class to alcohol content. In order to become aware of the varying strengths of alcoholic drinks, class members complete a chart and plot a bar chart with the results. They make observations about the results.
Curated OER
Predicting the Future
Young scholars examine how scientists predict the effects of global climate change. In this environmental science lesson, students participate in a discussion about using computer generated data to create climate predictions. Young...
Curated OER
Greenhouse Effect: Pop Bottle Experiment
Students explore global warming by conducting a weather experiment. In this greenhouse gas lesson, students define the greenhouse effect and the impact on our ozone layer. Students utilize a soda pop bottle, floodlight bulb, thermometers...
Curated OER
Fish Communities in the Hudson
Learning to read data tables is an important skill. Use this resource for your third, fourth, or fifth graders. Learners will will study tables of fish collection data to draw conclusions. The data is based on fish environments in the...
Curated OER
Comparing Light Bulbs
An average home produces twice as many emissions as an average car. Teach your class how to reduce energy consumption by replacing standard incandescent light bulbs with compact fluorescent light bulbs. Perform an experiment to compare...
Curated OER
The Bean Growth Experiment
Fifth graders use modern technologies which allow them to gain a new, dynamic, and intersting understanding of themselves, their community, and the world. They focus on environmental education and the effect of the environment on plant...
Curated OER
World of the Pond
Field trip! The class will review what they know about organisms that dwell in freshwater ponds, then trek down to the old water hole to collect specimens for examination. This includes several web links, useful tips, and an excellent...
Teach Engineering
Bone Mineral Density Math and Beer's Law
Hop into a resource on Beer's Law. A PowerPoint presentation introduces Beer's law as part of calculating bone density from X-ray images in the sixth lesson plan in the series of seven. Individuals work on practice problems with this law...
Curated OER
Data, Data, Everywhere... and What Am I To Think?
Students demonstrate good random sampling techniques for data collection, select and develop graphic presentations of data and analyze the data to solve a problem presented.


