Curated OER
Gathering Data to Problem Solve
Learners, while using reading and writing strategies (subheads, prediction, skim, details, drawing inferences, etc,), solve math problems that involve gathering and representing data (addition, subtraction, multiplication). They practice...
Curated OER
Chocolate Preferences Voting and Graphing Techniques
Students practice sampling and graphing techniques. In this data collection and interpretation lesson plan, students write and conduct surveys about chocolate preferences and then collect their data. Students graph the data in order to...
Curated OER
The Cricket in Times Square
Fourth graders explore vocabulary by reading a contemporary story in class. In this English literature instructional activity, 4th graders read the story A Cricket in Times Square and practice using the vocabulary words from the story....
Curated OER
Literacy: Slowly, Slowly, Slowly Said the Sloth
Students explore language arts by analyzing a children's book in class. In this vocabulary lesson, students read the book Slowly, Slowly, Slowly... by Eric Carle. Students identify the characters, setting and plot of the story before...
Curated OER
Reading: No Home on the Range
In this poetry analysis worksheet, students read a poem called "No Home on the Range" by LaVonne Houlton. Students answer 8 multiple choice questions about the poem.
Curated OER
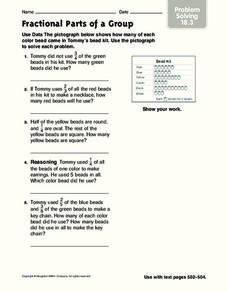
Fractional Parts of a Group
In this problem solving worksheet, students problems solve the answers to 5 mathematical word problems involving fractional parts. Students use data from a pictograph to assist them in solving each word problem.
Curated OER
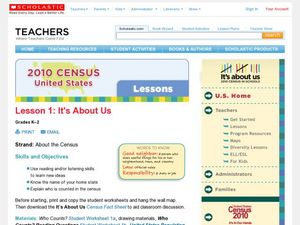
2010 Census Lesson 1: It's About Us
Students analyze data from the 2000 census to learn how the census works. In this civics lesson, students read a story to find out about the census, then use a map and census data to analyze changes. Lesson includes related resources...
Curated OER
Random Sampling
For this random sampling worksheet, students compare data collected by a random sample to data collected by an actual count using pieces of paper with numbers written on them. They compare their data for the actual count to the random...
Alabama Learning Exchange
Tiger Math Graphing
Learners practice various skills using the book Tiger Math: Learning to Graph from a Baby Tiger. After listening to the story, they create a pictograph using data collected from the text. They also color a picture of a tiger, collect...
Curated OER
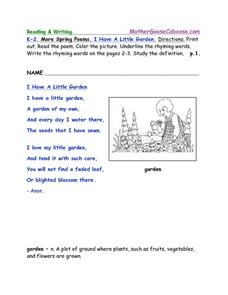
I Have A Little Garden
For this poetry worksheet, students read the poem "I Have A Little Garden," color the picture, underline the rhyming words in the poem and then write the rhyming words on pages two through three.
Curated OER
Ladybug Poem
For this poetry worksheet, students read the poem "Ladybug," color the picture, underline the rhyming words and then write the rhyming words on pages two through four.
Curated OER
How Do Earthquakes Affect Buildings?
Students simulate earthquakes utilizing an online program, and examine the earthquake-proofing construction for their building. They chart and analyze their simulated data using
Curated OER
The Caterpillar
In this poetry worksheet, students read the poem "The Caterpillar," color the picture, underline the rhyming words and then write the rhyming words on pages two through six.
Curated OER
Range, Mean, Median, Mode
Students research the impact of craters. In this range, mean, median and mode lesson, students complete an experiment with a marble to simulate the effects of a crater. Students collect and analyze data finding the range, mean, median...
Curated OER
All About Graphs
Students practice organizing data by creating graphs. In this statistics instructional activity, students survey the class about favorite colors and create a bar graph using the data. Students complete a test based on pet and animal...
Curated OER
Alphabet Soup Job Descriptions
Eleventh graders investigate New Deal programs. In this Great Depression lesson, 11th graders read the provided source materials that detail the agendas of 3 New Deal agencies. Students complete the provided analysis sheets and then...
Curated OER
You Be The Census Taker
Learners interpret information from an excerpt of the 1870 U.S. Census and compare that data to economic data they collect about local businesses in their own community. Students then evaluate how closely linked their community's economy...
Curated OER
Adopt a City-Winter Weather
In weather activity, students use an on line site to collect weather data. They create 10 different weather scenarios using a temperature and humidity slider. They includethe temperature, relative humidity and weather conditions and...
Curated OER
Calculating Baseball Statistics
Students calculate baseball statistics. In this data analysis lesson plan, students use baseball statistics to calculate the batting average and slugging percentage. Students visit www.funbrain.com to play a math baseball game.
Curated OER
Interpreting Political Cartoons in the History Classroom
Students analyze political cartoons. In this historical perspectives lesson, students use the provided cartoon analysis worksheet to examine the political cartoons that their instructor shares with them.
Curated OER
Shaky New Zealand
Students explore geography by answering study questions in class. In this plate tectonics lesson, students identify the earthquake data concerning the country of New Zealand and answer questions regarding the data. Students identify...
Curated OER
What Did It Cost 100 Years Ago?
Students compare prices of good across the century in order to introduce the topic of inflation. They undertand the concepts of inflation and Consumer Price Index (CPI), use online calculators to figure the approximate cost of goods...
Curated OER
Populations and Life Cycles
Students explore biology by researching ocean statistics. In this data analysis lesson, students conduct a snail examination experiment utilizing live pouch snails. Students collect data about the snails over the course of six weeks and...
Pennsylvania Department of Education
Multiplication Represented as Arrays
Third graders collect data about themselves and use in a line plot. In this analyzing data activity, 3rd graders collect various sets of information,create a line plot and compare the data. Students complete a worksheet on their results.
Other popular searches
- Word Analysis and Decoding
- Word Analysis Strategies
- Word Analysis Skills
- 500 Word Character Sketch
- Vocabulary Word Analysis
- Powerpoint Word Analysis
- Word Analysis 1.5
- Ell Reading Word Analysis
- Vocabulary, Word Analysis
- Word Analysis 15
- Ell+reading Word Analysis
- Word Analysis Worksheets


