Curated OER
The Standard Form of A Quadratic Equation
Students investigate equations that are in the standard form of a quadratic equation represented as Y=ax2+bx+c. They factor the equations into linear factors to determine the x intercepts. The graph is also used to determine the x...
Curated OER
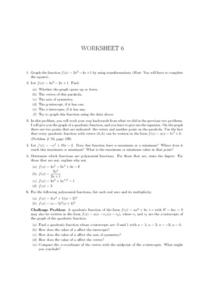
Worksheet 6, Graphing Functions
In this algebra worksheet students graph a given function by completing the square. They analyze a function and tell the axis of symmetry, the intercepts, and vertex. Students identify the maximum or minimum of a graph. Students identify...
Mt. San Antonio Collage
Quadratic Functions and Their Graphs
Starting with the basics, learners discover the features of a parabola and the ways to accurately graph it. After pupils practice with graphing, the end of the worksheet focuses on application type problems.
Mt. San Antonio Collage
Test 2: Rationals, Exponentials, and Logarithms
Running out of logarithm questions in class? The nicely organized two-page worksheet provides practice in rational, logarithmic, and exponential functions. All the topics include graphing, solving, and finding domain and range.
Mt. San Antonio Collage
Graphs of Rational Functions
Sometimes graphing rational functions can feel a little "irrational." Starting with the basics, learners work their way through the pieces of these graphs and finish off with an application question.
Curated OER
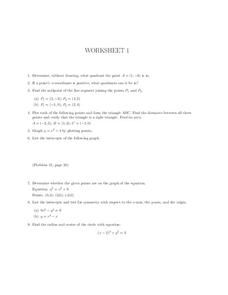
Worksheet 1, Coordinate Graphing
In this algebra worksheet, learners determine the quadrant a given point is in. They find the midpoints of two line segments. Students plot points to form a triangle and find the distance between points. Learners find the area of the...
West Contra Costa Unified School District
Discovering Slope of a Line in Standard Form
From start to finish this skills practice resource provides a way for individuals to explore the standard form equation of a line. Begin with a warm-up, work through the problems, and then discover the relationship between the...
West Contra Costa Unified School District
Graphing Systems
Get hands on with solving systems of equations graphically. A solid lesson plan uses guided practice to show how to solve systems of linear equations. It allows time for sharing ideas and provides a printable matching activity...
Curated OER
Graphing Inequalities in Two Variables
This study guide is a great resource to help you present the steps to graphing linear inequalities. Show your class two different ways to graph an inequality and work on a real-world example together. The document could also be easily...
Curated OER
How Long Can You Go?
Eighth graders examine the usefulness of a line of best fit by collecting and graphing data, using a graphing calculator to determine the line of best fit, and making a variety of predictions. They watch a video, then design a...
Curated OER
Graphical Analysis
Get out your TI-nspire graphing calculator and explore polynomials. Learners determine where a given polynomial are increasing or decreasing, find maximums, minimums, and zeros of polynomials, and discuss end behavior of polynomials....
Curated OER
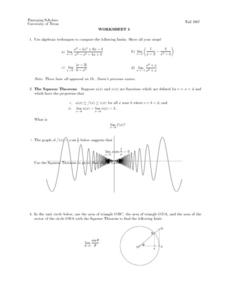
Worksheet 5 - Squeeze Theorem
In this Squeeze Theorem worksheet, students compute limits, identify a graph that represents the Squeeze Theorem, and graph given functions. This two-page worksheet contains seven multi-step problems.
Ms. Amber Nakamura's Mathematics Website
Algebra Project
What would your dream house look like? A cottage? A medieval castle? High schoolers enrolled in Algebra design the perfect house while using slopes to write equations for various aspects of the project.
Curated OER
How Alike Are We?
Fourth graders find the range, mode, median, and mean for each of the data sets (height and shoe size). They discuss which measure of central tendency for each data set best represents the class and why. Students graph the shoe size and...
Curated OER
Maximize It!
Pupils design a rectangular box without a lid that has the largest possible volume using the supplied sheet of centimeter graph paper. They work in groups to construct different size boxes to determine the largest possible volume and...
Curated OER
Applying Properties to Variables
Eighth graders combine like terms in this properties of variables lesson. Using named items (stars, moons and hearts), they combine like terms using variables. They use the distributive property to combine like terms. Finally, they write...
University of North Texas
Math Exam 1 Review
Perfect as a review guide, this learning exercise provides a range of questions focusing on functions. Topics include composing functions, transformations, domains, and polynomials. Also included are corresponding worksheets focusing on...
Wordpress
I Can Find Slope
Your young mathematicians will appreciate this wonderfully organized summary and explanation of linear slope. Approaching slope as it looks in a table of values, on a graph, in an equation, and between two points, this note sheet is...
West Contra Costa Unified School District
Standard Form of Conics
Looking for a complete go-to guide for the standard form of conics? This five-page packet does a nice job of connecting conics to prior knowledge of functions and transformations. Adapt the resource as Algebra II lesson plan...
Virginia Department of Education
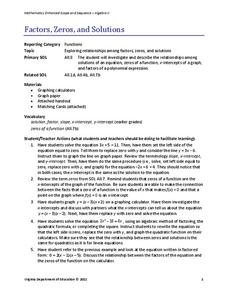
Factors, Zeros, and Solutions
Factors, zeros, and solutions, oh my! Don't let your classes become overwhelmed with the vocabulary. An engaging lesson helps learners make a connection between factors, zeros, and solutions. Pupils explore the relationship between the...
University of Texas
A Library of Parent Functions
Don't think this lesson is for Mom and Dad; parent functions are all for your high schoolers. Flip through a presentation with a focus slide on each type of graph and its characteristics. Some examples are included but the...
Curated OER
Graphing Linear Equations
In this calculator active graphing worksheet, students graph 12 equations via a calculator and transfer the graphs onto coordinate grids.
BW Walch
Creating and Graphing Linear Equations in Two Variables
This detailed presentation starts with a review of using key components to graph a line. It then quickly moves into new territory of taking these important parts and teasing them out of a word problem. Special care is...
Curated OER
Graphing Exponentials
Bring your Algebra class to the computer lab! Using materials created by Texas Instruments, they explore exponentiasl and graphs. Be sure to download the correct materials (on the right side of the webpage) before having them walk...
Other popular searches
- Finding X and Y Intercepts
- Graph Using X and Y Intercepts
- Finding the X and Y Intercepts
- X Y Intercepts Graphing
- Graph X and Y Intercepts
- Graphing X and Y Intercepts
- Y X Intercepts


