Mathematics Vision Project
Features of Functions
What are some basic features of functions? By looking at functions in graphs, tables, and equations, pupils compare them and find similarities and differences in general features. They use attributes such as intervals of...
West Contra Costa Unified School District
Using Derivatives to Graph Polynomials
You can learn to graph as well as a calculator using calculus. The lesson introduces using derivatives to find critical points needed to graph polynomials. Pupils learn to find local maximums and minimums and intervals of increase and...
EngageNY
Four Interesting Transformations of Functions (Part 4)
What do you get when you cross piecewise functions with transformations? An engaging lesson! The conclusion of a four-part series on the transformations of functions asks class members to apply transformations to piecewise functions...
Project Maths
Trigonometric Functions
From a circle to a cycle! The final lesson of a five-part series challenges learners to use points from the unit circle to plot a repeating pattern. The repeating patterns become the graphs of the trigonometric functions. Scholars also...
Curated OER
Graph, Identify Asymptotes, Find Domain and Range, for Eleven Simple Rational Functions
Using this worksheet, pupils graph 11 simple rational functions. They also find asymptotes, domain, and range for each function. The solutions are provided.
EngageNY
Graphs of Quadratic Functions
How high is too high for a belly flop? Learners analyze data to model the world record belly flop using a quadratic equation. They create a graph and analyze the key features and apply them to the context of the video.
Shodor Education Foundation
Multi-Function Data Flyer
Explore different types of functions using an interactive lesson. Learners enter functions and view the accompanying graphs. They can choose to show key features or adjust the scale of the graph.
Flipped Math
Calculus AB/BC - Sketching Graphs of Functions and Their Derivatives
Find deeper meaning in graphs. Pupils use the knowledge gained from the previous sections in the unit to sketch graphs of a function's derivative. Learners also see how to sketch a graph of a function given the graph of its derivatives....
Illustrative Mathematics
Graphing Rational Functions
The slider feature on Desmos excellently shows how graphs change based on different variable values. Learners look at two similar rational functions and compare and discuss what happens when the numbers go from positive to zero to...
EngageNY
Graphs Can Solve Equations Too
There are many equations Algebra I students are not ready to solve. Graphing to solve gives them a strategy to use when they are unsure of an algebraic approach to solve the problem. The lesson plan exposes learners to a wide variety of...
Curated OER
Interpreting Graphs
Sixth graders interpret linear and nonlinear graphs. They create graphs based on a problem set. Next, they represent quantitive relationships on a graph and write a story related to graphing.
Flipped Math
Transformations of Functions, Pt. 1
It is transformational! With the beginning lesson on transformations, pupils learn about vertical and horizontal translations. Scholars see how to graph important points to show the translations and then to write the transformed graph in...
Illustrative Mathematics
Identifying Exponential Functions
Class members have the opportunity to quickly change the variables of an exponential graphs through the use of sliders on Desmos. Four graphs are given and young mathematicians, through the use of the graphing app, can discover which...
Curated OER
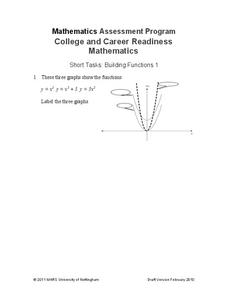
Building Functions
Pupils determine equations that match the graphs of transformations and the parent quadratic function. The resource requires class members to attend to precision and think abstractly.
EngageNY
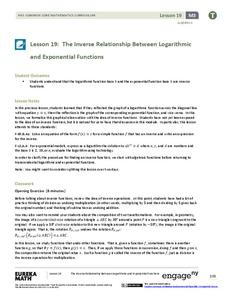
The Inverse Relationship Between Logarithmic and Exponential Functions
Introducing inverse functions! The 20th installment of a 35-part lesson encourages scholars to learn the definition of inverse functions and how to find them. The lesson considers all types of functions, not just exponential and...
CK-12 Foundation
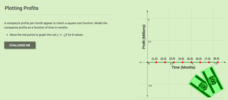
Graphs of Functions Based on Rules: Plotting Profits
Profit from this interactive on graphing and interpreting functions. An interactive allows learners to plot a square root function representing a company's profits. They answer some challenge questions that require interpreting this...
West Contra Costa Unified School District
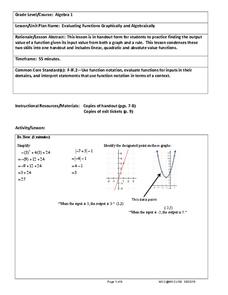
Evaluating Functions Graphically and Algebraically
High schoolers evaluate functions graphically and algebraically. After completing that step, they write a statement describing the input and output.
K20 LEARN
Family Ties: Exploring Families OF Functions
They say it runs in the family. Small groups use a card sorting activity to group graphs of functions into families. After grouping by families, the class develops conclusions for parent functions and create a graphic organizer.
CK-12 Foundation
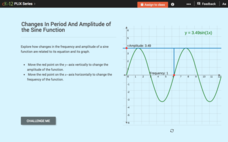
Changes in Period and Amplitude of the Sine Function
How does a change in amplitude or period affect the equation of a sine function? Scholars move sliders to change the frequency and period of the sine function. The interactive displays the resulting equation, and pupils determine the...
Flipped Math
Transformations of Functions, Pt. 2
Workout with stretches and compressions. Scholars view what happens to the graph when multiplying a function by a number. Learners combine stretches and compressions with translations before practicing the newly learned skill by pausing...
Curated OER
Functions - Intro and Inverses
Define the terms domain, range, function, vertical limit test, and linear function notation with your class. They can then, graph several equations applying the vertical line test to determine which are and which are not functions, write...
Flipped Math
Calculus AB/BC - Determining Intervals on Which a Function is Increasing or Decreasing
Going up? Wait, it might be going down! Learners watch a video to see how to use the derivative and critical points to find where a function is either increasing or decreasing. Individuals use the rate of change to solve real-world...
Curated OER
Mystery Liquids: Linear Function
High schoolers determine the linear equations of the density of water and oil by collecting data on the mass of various volumes of each liquid. They construct scatter plots from the data and use these to write the linear equations for...
Curated OER
Graphing Linear Equations Cards
OK, so maybe graphing linear equations can be fun. This activity includes a set of linear equation cards to be cut and place face up on a table. Learners pick a card and match it to the correct graph card. This is a really fun way to...
Other popular searches
- Cosine Function Graphs
- Function Graphs Pre Algebra
- Graphs and Function Tables
- Continuous Graph
- Graph Function Tables
- Graph Exponential Function
- Graph Linear Function
- Step Function Graphing
- Exponential Function Graphs
- Constant Function Graphing
- Continuous Data Graphs
- Function Graphs Prue Algebra


