EngageNY
Graphing the Sine and Cosine Functions
Doing is more effective than watching. Learners use spaghetti to discover the relationship between the unit circle and the graph of the sine and cosine functions. As they measure lengths on the unit circle and transfer them to a...
Curated OER
Piecewise Linear Functions: Extending Stories to Graphs
Using this resource, scholars develop graphs that model situations by showing change over time. They answer 15 questions based on information from charts that show growth in weight. They extend the concepts to an assessment section of...
Illustrative Mathematics
Introduction to Linear Functions
Introduce your algebra learners to linear and quadratic functions. Learners compare the differences and relate them back to the equations and graphs. Lead your class to discussions on the properties of a function or a constant slope...
Illustrative Mathematics
Graphs of Quadratic Functions
The equations look different, but their graphs are the same. How can that be? This activity leads your mathematicians in an exploration of three different forms of the same quadratic function. After comparing the equations, their graphs,...
Illustrative Mathematics
Telling a Story With Graphs
Turn your algebra learners into meteorologists. High schoolers are given three graphs that contain information about the weather in Santa Rosa, California during the month of February, 2012. Graph one shows temperatures, graph two...
EngageNY
Graphs of Linear Functions and Rate of Change
Discover an important property of linear functions. Learners use the slope formula to calculate the rates of change of linear functions. They find that linear functions have constant rates of change and use this property to determine if...
Illustrative Mathematics
Graphs of Quadratic Functions
Instead of the typical quadratic questioning, explore the function and look at the three different ways a parabola can be written. The main task is when given several clues, young mathematicians must write an equation that matches the...
West Contra Costa Unified School District
Connecting Graphing and Solving Absolute Value Equations and Functions
Can you solve an equation graphically? Absolutely! This Algebra II lesson makes the connection between solving an absolute value equation and graphing two functions. Graphing absolute value functions is presented through the process of...
Texas Instruments
Changing Functions
Your algebra 2 learners show what they can do in this assessment activity on shifting, reflecting, and stretching graphs. Given the graphs of various functions, they write the represented equation.
Curated OER
Identifying Linear Functions from Graphs
Keep your mathematicians engaged using this group linear functions activity. Each of ten groups receives two graphs with both an image and equation, as well as a "who has" phrase to call out the next graph. Scholars stay on their toes as...
Curated OER
A Sum of Functions
Collaborative learners will see the geometric addition of functions by graphing the sum of two graphed curves on the same coordinate plane. This task then naturally flows into giving learners the algebraic representation of the curves...
Houghton Mifflin Harcourt
Graphs from Patterns
Fifth graders analyze patterns and begin looking at function tables. This is a pertinent preparation for graphing patterns. In fact, consider giving your class a piece of graph paper and then teach them how!
Illustrative Mathematics
Identifying Quadratic Functions (Vertex Form)
Pupils calculate the equation of a quadratic in vertex form from a specific graph and determine an equation that would fit the description of a parabola. The final question determines the individuals' understanding of the signs of the...
Mathematics Assessment Project
Representing Quadratic Functions Graphically
Sometimes being different is an advantage. An engaging activity has scholars match cards with quadratic functions in various forms. Along the way, they learn about how each form highlights key features of quadratic functions.
Shodor Education Foundation
Graph Sketcher
Sketch graphs with the Graph Sketcher. Scholars graph functions on a coordinate plane. An interactive makes it as easy as inputting the function and clicking a button.
EngageNY
Interpreting the Graph of a Function
Groups sort through NASA data provided in a graphic to create a graph using uniform units and intervals. Individuals then make connections to the increasing, decreasing, and constant intervals of the graph and relate these connections...
CK-12 Foundation
Graphs of Functions Based on Rules: Plotting Profits
Profit from this interactive on graphing and interpreting functions. An interactive allows learners to plot a square root function representing a company's profits. They answer some challenge questions that require interpreting this...
University of North Texas
Library of Functions
Join the family picnic and see how all the functions come together in a PowerPoint that highlights their main features. As it includes topics such as domain, range, and intercepts, the slides are a great guide to promote class discussions.
University of Northern Texas
Continuity
Continue a study of calculus by using a slideshow to introduce the concept of continuity. After defining the term, the presentation provides examples of functions that are discontinuous and introduces different types of...
CK-12 Foundation
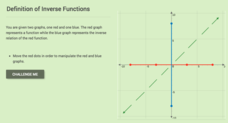
Inverse Functions: Definition of Inverse Functions
Is the inverse of a function also a function? Pupils manipulate the graph of a function to view its inverse to answer this question. Using a horizontal and vertical line, class members determine whether the initial function is...
Illustrative Mathematics
Function Rules
Function machines are a great way to introduce the topic of functions to your class. Here, you will explore the input and output to functions both using numerical and non-numerical data. Learners are encouraged to play with different...
CK-12 Foundation
Definition of Inverse Functions
Investigate the definition of inverse functions graphically. Using the interactive, scholars create a graph of a function and view its resulting inverse. They then determine whether a group of functions have inverses that are also...
Mt. San Antonio Collage
Graphing Trigonometric Functions
Double win with a comprehensive worksheet and an excellent worked out answer key. The worksheet itself is twelve pages and begins with the simple sine and cosine graphs, then, develops into the reciprocal trig functions.
EngageNY
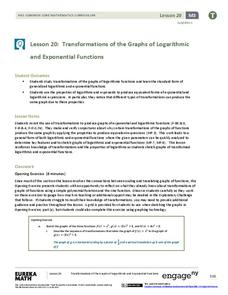
Transformations of the Graphs of Logarithmic and Exponential Functions
Transform your lesson on transformations. Scholars investigate transformations, with particular emphasis on translations and dilations of the graphs of logarithmic and exponential functions. As part of this investigation, they examine...
Other popular searches
- Continuous Graph
- Graph Function Tables
- Trigonometry Functions Graph
- Function Table Graph
- Linear Functions to Graph
- Function Graph
- Sine Function Graph
- Logarithmic Function Graph
- Graph Function and Integers
- Continuous Line Graph
- Nonlinear and Linear Graph
- Function. Graph


