Curated OER
Basic Stats
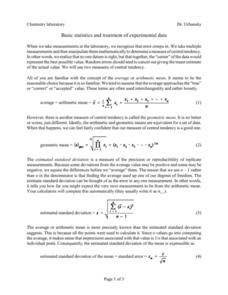
In this chemistry worksheet, students focus upon the concepts of mean and standard deviation and how it is used in the laboratory to interpret data.
Curated OER
Baseball Stats
Middle schoolers explore data sheets and statistics in baseball. They use baseball data available on the Internet to develop an understanding of the different ways in which data can be analyzed.
Curated OER
Starting With Stats
Statisticians analyze a data set of student IQs by finding measures of central tendency and dispersion such as mean, median, mode, and quartiles. They practice using a graphing calculator to find the values and analyze box plots and...
CCSS Math Activities
Smarter Balanced Sample Items: 7th Grade Math – Target G
Don't leave learning to chance! Assess your class's understanding of random sampling and making inferences using questions from the experts at Smarter Balanced. As the seventh of nine parts in the Gr. 7 Claim 1 Item Slide Shows series,...
Curated OER
Comparing School Bus Stats
Engage in a lesson plan that is about the use of statistics to examine the number of school buses used in particular states. They perform the research and record the data on the appropriate type of graph. Then they solve related word...
Curated OER
Bureau Stats
Students explore the role of bureaucracy in United States government; they then examine the history, leadership, organization, and goals of executive agencies.
Curated OER
Smoking Today = Smoking Tomorrow
Examine statistical data to recognize the relationship of statistics to real-world issues. Pupils navigate e-stat using the Internet and find data about social issues. They complete a worksheet with their data and create an anti-smoking...
Curated OER
Quick Stats with Quick Poll
Learners analyze data using bar graphs and the TI in this statistics lesson. They investigate quick polls and graph the data using different properties of statistics. This assignment requires a TI Navigator.
Curated OER
Baseball Stats
Students explore data sets and statistics in baseball. They use baseball data available on the Internet to develop an understanding of different ways in which data can be analyzed. They access the Baseball Archive Website to do more...
Curated OER
Matrix Operations
Two real-world activities to practice adding, subtracting and multiplying matrices to problem solve. Data from several Pro football quarterbacks is used in one activity to make some predictions based on their stats. Then the class takes...
Curated OER
Linking Verb or Action Verb?
Part of exploring parts of speech is being able to distinguish between linking verbs and action verbs. One implies a stat of being, and one expresses an action. After reviewing the definition briefly, provide your middle schoolers with...
Dick Blick Art Materials
A.T.C. (Artist Trading Cards)
Trade 'em, flip 'em, save 'em. Yes, it's trading cards! Kids design their own artist trading cards, complete with images and stats.
National Wildlife Federation
The Amazing Adventures of Carbon: How Carbon Cycles through the Earth
Here's a stat for your pupils: 18 percent of the human body is carbon! Part 10 in the series of 12 takes pairs on an adventure through the carbon cycle. After a class reading about carbon, pairs read and choose their own adventure...
Teaching Tolerance
Voting in Your Town
A socially important resource focuses on voter turnout and roadblocks to voting. Scholars review resources on voting stats, watch a documentary, and participate in group discussion regarding voting in their local communities. Academics...
Nemours KidsHealth
Bike Safety: Grades 9-12
Here's a sobering stat: more than 300,000 kids go to emergency rooms each year for bike injuries. Two activities help scholars learn how to avoid injuries and follow bike safety rules. Class members read three background articles related...
Curated OER
Samples and Stats
Students explore different methods of taking surveys and conducting polls and examine these methods for bias. They design and administer a sample survey, analyze the data and present their findings to the class.
Curated OER
Statistics and Shopping
Explore how statistics are used in everyday life. Your soon-to-be savvy consumers use the Internet to find consumer-related statistical information and learn to make wise consumer decisions. Includes links to a practice sheet about data...
Curated OER
Character Baseball Cards
Create baseball cards for literary characters with this lesson plan. It introduces students to baseball cards, their components (stats, picture, etc.), and prompts them to draft and publish their own cards based on figures from...
Curated OER
Canada and its Trading Partners
Students identify the relationship between Canada and its trading partners. They use two data sources, Canadian Statistics and E-STAT, on the Statistics Canada website to explore the growing importance of trade in general.
Curated OER
Distribution of children living at home
Students use E-STAT to examine demographics. In this social demographics lesson, students use statistical data to determine if a particular family is in need of assistance. Students will discuss social and educational policies and...
Curated OER
TI-82 PROFICIENCY
Young scholars find the proper factors for numbers one through fifty using either the divisibility laws or TI-82. They determine the sum of the proper factors for each number. If the sum of the factors is less than the number itself,...
Curated OER
How's The Weather?
Students make a box and whiskers plot using the TI-73 graphing calculator. Each student would have their own calculator but they would work in small groups of two or three to help each other enter the data and make the plots.
Curated OER
How Many?
Students investigate concepts related to data collection and interpretation. They generate all possible outcomes in a beginning study in the realm of statistics. The use of real life situations helps to engage students.
Key Stage Fun
Squeebles Times Tables 2
The Squeebles are back, and this time they are ready to help young mathematicians gain fluency in their multiplication skills. This app allows for practice and testing through a number of fun, and at times, challenging, educational games.
Other popular searches
- Baseball Stats
- Stats Minister
- Sports Stats
- Worksheets on Stats
- Water Pollution Stats
- Stats Sports Injury
- Bureau Stats
- Excel Football Stats
- Excel, Football Stats
- Baseball Stats Math
- Southeast Stats
- Universal Health Care Stats


