Curated OER
Energy Conservation Lesson 1: Fossil Fuels and the Ticking Clock
Students explore energy production by participating in a class discussion. In this renewable energy instructional activity, students discuss the differences between solar, coal, wind and fossil fuel energy sources and why some are better...
Curated OER
What's Your Shoe Size? Linear Regression with MS Excel
Learners collect and analyze data. For this statistics lesson, pupils create a liner model of their data and analyze it using central tendencies. They find the linear regression using a spreadsheet.
Curated OER
A World of Information
Students analyze data and statistics about countries around the world. They read graphs and charts, color a world map to illustrate the top ten statistics about the world, and write a paragraph to summarize their information.
EngageNY
End-of-Module Assessment Task - Algebra 1 (Module 2)
Check for understanding at the end of your descriptive statistics unit with an end-of-module assessment. It uses five questions to measure progress toward mastery of descriptive statistics standards. Each question is developed to address...
EngageNY
Mid-Module Assessment Task - Algebra 1 (module 2)
A mid-module assessment uses two multi-part questions to measure progress toward mastery on descriptive statistics standards. Each part of a question addresses a single standard to help determine mastery.
Balanced Assessment
Presidential Popularity
Media often misrepresent data and statistics to their advantage. This lesson asks scholars to analyze an article with misleading statistics. They use margin of error and mean data in their studies. Once they complete their analysis,...
Illustrative Mathematics
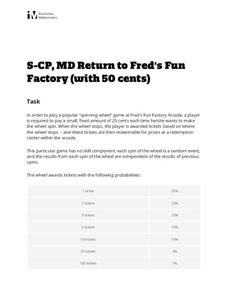
Return to Fred's Fun Factory (with 50 Cents)
The penny arcade gets the statistics treatment in this fun probability investigation. A non-standard game of chance is described and then the class is set loose to find missing probabilities, determine common outcomes, and evaluate...
Curated OER
Judge and Jury
Students participate in activities in which they focus on the uses of numbers. In this numerology lesson, students measure distances using standard and non-standard units and record their measurements in various tables. Students also use...
American Statistical Association
An A-MAZE-ING Comparison
Teach your class how to use descriptive statistics through a hands-on data collection activity. Pupils collect their own data, calculate test statistics, and interpret the results in context. They compare male and female results, looking...
EngageNY
Distributions and Their Shapes
What can we find out about the data from the way it is shaped? Looking at displays that are familiar from previous grades, the class forms meaningful conjectures based upon the context of the data. The introductory lesson to descriptive...
Curated OER
Infusing Equity Gender into the Classroom
Students investigate if gender makes a difference in the classroom. For this statistics lesson, students collect data on whether equity by gender in the classroom makes students more successful.
Radford University
Is Fall Normal?
Fine the normality of fall measurements. Pairs collect measurements of fall leaves and one other fall object. Using the measurements, the groups determine the descriptive statistics for the object and using the Empirical Rule, figure out...
Curated OER
Quick Stats with Quick Poll
Learners analyze data using bar graphs and the TI in this statistics lesson. They investigate quick polls and graph the data using different properties of statistics. This assignment requires a TI Navigator.
Curated OER
Penny's Pizza
Students develop a list of possible outcomes as a method of finding probability related to a pizza statistics problems. They read the problems together as a class, brainstorm ways to solve the problem, and in partners solve the pizza...
Curated OER
Box Plots
For this statistics worksheet, students analyze problems by finding the mean, median and mode. They also set data by their median, and quartiles. There are 7 questions dealing with 2 different sections.
Curated OER
Venn Diagrams
Students collect and display data in a Venn Diagram. In this statistics lesson, students collect data, compare the data and make inferences about their data. They use the Venn diagrams to identify what the data have in common and how...
Curated OER
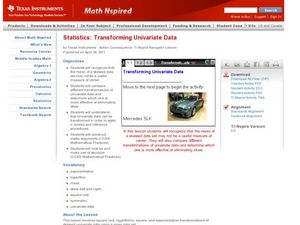
Transforming Univariate Data
Learners analyze plotted data in this statistics instructional activity. They differentiate between skewed and normal data. They also explore and interconnect exponential growth and decay as it relates to the data.
Curated OER
Investigating Correlation
High schoolers investigate different types of correlation in this statistics lesson. They identify positive, negative and no correlation as it relates to their data. They then find the line of best fit for the plotted data.
Curated OER
Handling Data: Representing Date - Online Version
Here is an online lesson plan on data representation. In it, learners access websites embedded in the plan which lead them through a variety of activities around data representation and statistics. The activities are quite good, and...
Curated OER
Baseball Statistics
Students read "Casey at the Bat" and then use individual player statistics (found through internet research)to determine if their players could be considered baseball "heroes". They must justify their choices for "hero" by creating...
Curated OER
Statistical Analysis of Data by Gender
Students examine and identify gender bias, stereotyping, and discrimination in school materials, activities, and classroom instruction. They apply descriptive statistics knowledge to real-world data.
Curated OER
Introduction to Descriptive Statistics
Students follow examples to study basic concepts of statistics. They work independently through the activities.
Curated OER
Monitoring Math with a Statistical Spreadsheet
Students use a spreadsheet to compute landmark statistics of a math
quiz. This lesson can be ongoing throughout the school year and it integrates mathematics curriculum and technology in a simple format for student use.
Curated OER
Starting With Stats
Statisticians analyze a data set of student IQs by finding measures of central tendency and dispersion such as mean, median, mode, and quartiles. They practice using a graphing calculator to find the values and analyze box plots and...


