Curated OER
Paper Production
Students compare paper making by hand and by assembly line. In this manufacturing lesson, students compare and contrast the two main ways to make paper, by hand or by machine. Students research paper making and have a class discussion...
Curated OER
On the Line
Pupils view a television program that traces the use of the assembly line in mass production and the subsequent conflict between workers' rights and management. They analyze and discuss the portrayal of the American worker over time and...
Curated OER
NUMB3RS Activity: Where’s the Source? Episode: “Undercurrents”
Several real-world problems are posed as a way to learn about vector fields in order to make some predictions after analyzing the data. The main problem comes from the tv show NUMB3RS and is based on solving a crime where a body has...
Curated OER
Individual Sundial (Cloud/Rain Activity)
Students make a simple sundial to examine the changes in shadows over time. In this sundial and shadow lesson, students make a simple sundial out of a manila folder and pencil. They observe how shadows change over time, and relate it to...
Curated OER
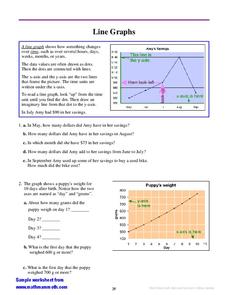
Line Graphs
In this interpreting line graphs worksheet, students read an explanation and observe an example of a line graph and its parts and then answer questions interpreting two line graphs. Students write eleven answers.
Curated OER
Cloudy vs. Clear
Students analyze line plots. For this weather lesson using real NASA data, students discuss how weather affects the way the Earth is heated by comparing different line plots.
Curated OER
Walking Down Main Street: The Changing Times of a Railroad Town
Students explore the historic district via a scavenger hunt. In this community history instructional activity, students complete a scavenger hunt using historic postcards and clues as guides. Students create a timeline demonstrating...
Curated OER
Earth's Rotation Changes and the Length of the Day
In this Earth's rotation and day length worksheet, learners are given a table with the period of geological time, the age of the Earth and the total days per year. Students calculate the number of hours per day in each geological era,...
Curated OER
Don’t Cry Over Spoiled Milk!
Seventh graders explore how milk spoils over time. In this biology lesson, 7th graders discover how pH changes as microorganisms enter the food and multiply. They explain the benefits of pasteurization process.
Curated OER
Creating Line Graphs
Students relate data to coordinate graphs and plot points on this graph. They use minimum wage data to construct the graph. Students decide appropriate time intervals for the graphs. They share graphs with their classmates.
Curated OER
A Little Horse Sense
How have horses evolved over time? How do horse skulls reveal this evolution? How have the roles horses play changed over time? What kind of social structure do horse herds have? How should wild horse populations be managed? To find the...
Curated OER
Olympic Line Graphs
Sixth graders examine how to make line graphs. In this Olympic line graph lesson students make line graphs and search the given Internet sites to find data on their summer Olympic Game.
Inside Mathematics
Squares and Circles
It's all about lines when going around. Pupils graph the relationship between the length of a side of a square and its perimeter. Class members explain the origin in context of the side length and perimeter. They compare the graph to the...
Cornell University
Constructing and Visualizing Topographic Profiles
Militaries throughout history have used topography information to plan strategies, yet many pupils today don't understand it. Scholars use Legos and a contour gauge to understand how to construct and visualize topographic profiles. This...
Curated OER
Cartoons for the Classroom: Politics of Change
Empty rhetoric in Washington timelessly inspires political cartoons. Examine this concept through an analysis handout, which features a cartoon by Pat Oliphant (archived work is linked for possible extension activities). Although this...
Balanced Assessment
Ford and Ferrari
Which is faster, a Ford or a Ferrari? The short assessment has pupils analyze graphs to determine the rates of change between the two. Individuals interpret the rates of change within the context of speeds of the cars and develop a map...
K12 Reader
What Glaciers Leave Behind
Glaciers may seem distant and stationary, but they are huge deposits of moving ice that have made changes to the earth's surface. Your pupils can learn about the different types of impressions left by glaciers by reading the short...
Space Awareness
Making A Sundial
Can people really measure time just by using the sun? Scholars venture outside on a nice, sunny day to build sundials and learn how people measured time 600 years ago. The class builds two different sundials while gaining practice with...
Bowland
Fares Not Fair
What would be a fair fare for a taxi? to answer the questions requires young mathematicians to analyze data on fuel prices and taxi cab fares. They determine and justify a fair fare price.
Curated OER
Lesson #20 Rates of Change and Velocity
Young scholars investigate speed. In this rate of change lesson, students complete a rate/time/distance table to determine the average m.p.h. of a given trip. They listen and follow along with the lecture and examples to determine the...
Curated OER
PLATE MOVEMENTS AND CLIMATE CHANGE
Students label three geological maps with continents provided to analyze the relationships between the movement of tectonic plates and the changes in the climate. In small groups, they discuss their findings and form hypotheses about the...
Curated OER
A Sweet Drink
Students investigate reaction rates. In this seventh or eighth grade mathematics lesson plan, students collect, record, and analyze data regarding how the temperature of water affects the dissolving time of a sugar cube. Studetns...
Curated OER
Is Portland, Oregon Experiencing Global Warming?
Students use data to determine if the climate in Portland has changed over the years. In this weather instructional activity students complete line graphs and study long wave radiation.
West Contra Costa Unified School District
Sneaking Up on Slope
Pupils determine the pattern in collinear points in order to determine the next point in a sequence. Using the definition of slope, they practice using the slope formula, and finish the activity with three different ways to determine the...


